وب سایت تخصصی شرکت فرین
دسته بندی دوره ها

The Complete Tableau Bootcamp 2024

سرفصل های دوره

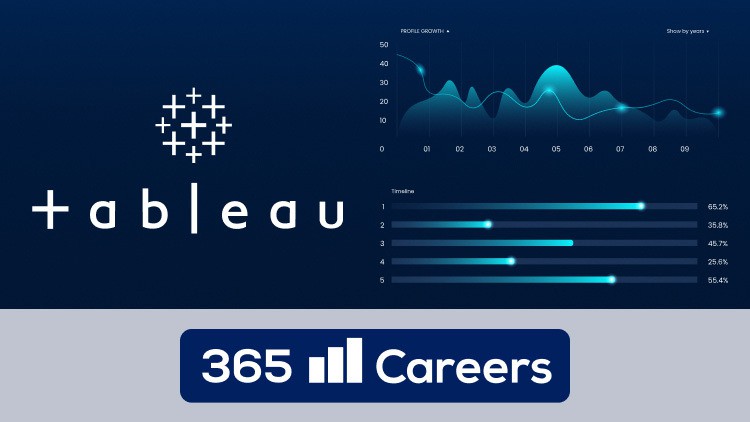
Complete Tableau Training: Learn How to Analyze Real-world Business Data


1. Introduction to Tableau
  • 1. Why use Tableau Make your data make an impact
  • 2. Lets download Tableau Public
  • 3.1 3. GDP-Data.xls
  • 3. Connecting data in Tableau
  • 4.1 4. GDP-Data.xls
  • 4. Exploring Tableaus interface
  • 5.1 6. GDP-Data.xls
  • 5. Lets create our first chart in Tableau!
  • 6.1 7. Tesla-sales-data.xlsx
  • 6. Duplicating a sheet
  • 7.1 8. Tesla-sales-data.xlsx
  • 7. Creating a table
  • 8.1 9. Tesla-sales-data.xlsx
  • 8. Creating custom fields
  • 9.1 10. Tesla-sales-data.xlsx
  • 9. Creating a custom field and adding calculations to a table
  • 10. Adding totals and subtotals
  • 11. Adding a custom calculation
  • 12. Inserting a filter
  • 13. Working with joins in Tableau

  • 2. Creating a Tableau Dashboard
  • 1.1 14. Audiobook-reviews.xlsx
  • 1.2 14. Audiobook-sales.xlsx
  • 1. Introduction to the exercise
  • 2.1 15. Audiobook-reviews.xlsx
  • 2.2 15. Audiobook-sales.xlsx
  • 2. Lets create a dashboard - Visualizing the three charts we want to create
  • 3.1 16. Audiobook-reviews.xlsx
  • 3.2 16. Audiobook-sales.xlsx
  • 3. Using Joins in Tableau
  • 4.1 17. Audiobook-reviews.xlsx
  • 4.2 17. Audiobook-sales.xlsx
  • 4. Performing a Numbers Check - Attempt #1
  • 5.1 18. Audiobook-reviews.xlsx
  • 5.2 18. Audiobook-sales.xlsx
  • 5. Blending Data in Tableau
  • 6.1 19. Audiobook-reviews.xlsx
  • 6.2 19. Audiobook-sales.xlsx
  • 6. Performing a Numbers Check - Attempt #2
  • 7.1 20. Audiobook-reviews.xlsx
  • 7.2 20. Audiobook-sales.xlsx
  • 7. First chart
  • 8.1 21. Audiobook-reviews.xlsx
  • 8.2 21. Audiobook-sales.xlsx
  • 8. Second chart
  • 9.1 22. Audiobook-reviews.xlsx
  • 9.2 22. Audiobook-sales.xlsx
  • 9. Third Chart
  • 10.1 23. Audiobook-reviews.xlsx
  • 10.2 23. Audiobook-sales.xlsx
  • 10. Creating and Formatting a Dashboard
  • 11.1 24. Audiobook-reviews.xlsx
  • 11.2 24. Audiobook-sales.xlsx
  • 11. Adding Interactive Filters for Improved Analysis
  • 12. Interactive filters - fix

  • 3. Introduction To The Sign-Up Flow Optimization Analysis Case Study
  • 1. Motivation
  • 2. Understanding the 365s Sign-Up Process
  • 3. Basic Terminology
  • 4. Defining the Key Aspects of the Sign-Up Process
  • 5. Sketching the Story

  • 4. SQL Data Retrieving
  • 1. Types of Data Access
  • 2. Getting to know the Database
  • 3.1 signup flow database.zip
  • 3.2 signups conversion rate.zip
  • 3. SQL Query 1 Sign-Up Conversion Rate
  • 4. SQL Query 2 Sign-Up Types and Errors - Part 1
  • 5.1 signup types mod.zip
  • 5. SQL Query 2 Sign-Up Types and Erros - Part 2
  • 6.1 login types mod.zip
  • 6. SQL Query 3 Login Types and Errors - Homework.html

  • 5. Tableau Dashboard Sheets And Creating The Story
  • 1.1 signup conversion rate.csv
  • 1. SQL and Tableau
  • 2.1 signup conversion rate.csv
  • 2.2 visitor-to-free.zip
  • 2.3 visitor-to-registered.zip
  • 2. Sign-Up Conversion Rate
  • 3. Device and Operating System Distribution
  • 4.1 devices.zip
  • 4.2 signup types mod.rar
  • 4. Preferred Devices Horizontal Bar Chart
  • 5.1 operating systems.zip
  • 5.2 signup types mod.rar
  • 5. Preferred Operating System Horizontal Bar Chart
  • 6.1 error messages.zip
  • 6.2 sign-up types.zip
  • 6.3 signup types mod.rar
  • 6. Sign-Up Types and Errors Bar Chart
  • 7.1 login errors.zip
  • 7.2 login types mod.rar
  • 7.3 login types.zip
  • 7. Login Types and Errors Bar Charts - Homework.html
  • 8. Creating Dashboards Getting Familiar with the Canvas
  • 9. Sign-Up Conversion Rates Sheet Swapping with Parameters
  • 10. Sign-Up Conversion Rates Containers
  • 11. Preferred Sign-Up Devices and Operating Systems
  • 12. Sign-Up Types and Errors
  • 13.1 login types dashboard.zip
  • 13. Login Types and Errors - Homework.html
  • 14.1 html color codes.pdf
  • 14. Formatting the Tableau Story - Part 1
  • 15.1 signup flow story.zip
  • 15. Formatting the Tableau Story - Part 2

  • 6. Analysis Report and AB Testing
  • 1. Dashboard Application for an Analysis Report
  • 2. Current State of Affairs Observing Story Point 1 - Conversion Rate
  • 3. Current State of Affairs Observing Story Point 2 - Sign-Up Types
  • 4. Current State of Affairs Observing Story Point 2 - Success Rate
  • 5. Current State of Affairs Observing Story Point 3 - Login Types
  • 6. Business Objective
  • 7. Hypothesis and Opportunity Sizing - Part 1
  • 8. Hypothesis and Opportunity Sizing - Part 2
  • 9.1 Analysis Report.pdf
  • 9. Actionable Insights Based on the Analysis
  • 10. Understanding the Fundamentals of AB Testing
  • 11. Setting Up an AB Test Confidence, Significance, and p-values
  • 12. Setting Up an AB Test Minimum Detectable Effect and Statistical Power
  • 13. Running an AB Test Execution and Analysing the Results
  • 14. Discussion on the Observations

  • 7. Discussion And Further Analysis Of A Website Sign-Up Flow
  • 1. Conclusions and Recommendations

  • 8. Introduction to The Customer Churn Analysis Case Study
  • 1. Introduction to the business case
  • 2. Basic Terminology - Net Revenue, Refunds, New vs Recurring Revenue
  • 3. Types of customers
  • 4. Basic Terminology - Customer Churn and Customer Retention
  • 5. Defining key questions for the customer churn analysis
  • 6. Creating an outline of the dashboard
  • 7.1 customer churn.zip
  • 7. Query 1 - Net Revenue
  • 8.1 365revenue query.zip
  • 8.2 365revenue.csv
  • 8. How to export data from Workbench
  • 9.1 365 user resurrections.zip
  • 9.2 365 user upgrades.zip
  • 9.3 365cohort orders annual.zip
  • 9.4 365cohort orders monthly.zip
  • 9.5 churn active passive course.zip
  • 9. Query 2 - User Resurrections and how to export data from Workbench

  • 9. Creating a Customer Churn Story in Tableau
  • 1.1 365revenue.csv
  • 1. Bar Chart - Net Revenue and Refunds
  • 2. Charts Formatting Styling Tips for Business Dashboards in Tableau
  • 3.1 365 customer churn revenue refunds.zip
  • 3.2 365user churn.csv
  • 3. Customer ChurnLine Chart in Tableau
  • 4.1 365 customer churn churn rates.zip
  • 4. Telling a Story with Data Create a Dashboard to Add to the Tableau Story
  • 5. New vs Recurring RevenueCombination Charts in Tableau
  • 6.1 365 customer churn new vs recurring revenue.zip
  • 6. Revenue by CountryMap Charts in Tableau
  • 7. Top 10 Countries by RevenueTables in Tableau
  • 8. Chart Formatting and Creating the Dashboard in Tableau
  • 9.1 365 customer churn user resurrections.zip
  • 9.2 365user resurrections.csv
  • 9. User Resurrections - Bubble Chart in Tableau
  • 10. User Resurrections Bar Chart in Tableau
  • 11.1 365user upgrades.csv
  • 11. Assignment 2 User Upgrades Bubble and Bar Chart.html
  • 12. Creating a date filter for page one of the report.html
  • 13. Building the Tableau Dashboard - Page 5
  • 14.1 365 customer churn user resurrections.zip
  • 14.2 365user cohort annual.csv
  • 14. Annual Subscribers - Order Frequency Combination Chart in Tableau
  • 15. Annual Subscribers Cohort Analysis Table in Tableau
  • 16.1 365user cohort monthly.csv
  • 16. Assignment 3 Monthly subscribers.html
  • 17.1 365 customer churn annual cohorts.zip
  • 17. Building the Tableau Dashboard Page 6
  • 18.1 365 customer churn.zip
  • 18. Dashboard Interpretation Net Revenue and Refunds
  • 19. Dashboard Interpretation Churn Rates
  • 20. Dashboard Interpretation New vs Recurring Revenue
  • 21. Dashboard Interpretation Maps and Revenue by Country Top 10
  • 22. Dashboard Interpretation Maps and Revenue by Country Average Order Value (AO
  • 23. Dashboard Interpretation User Upgrades
  • 24. Dashboard Interpretation User Resurrections
  • 25. Dashboard Interpretation Order Frequency Table and Cohort Analysis Annual Su
  • 26. Dashboard Interpretation Order Frequency Tables and Cohort Analysis Monthly
  • 27. What more is out there

  • 10. Introduction To The Customer Engagement Analysis Case Study
  • 1. The Case Study
  • 2. The Case Study.html
  • 3. Defining the Key Questions (Part 1)
  • 4. Defining the Key Questions (Part 1).html
  • 5. Defining the Key Questions (Part 2)
  • 6. Defining the Key Questions (Part 2).html
  • 7. Sketching the Dashboard (Part 1)
  • 8. Sketching the Dashboard (Part 2)

  • 11. Retrieving Relevant Data From The Database
  • 1.1 customer behavior.xlsx
  • 1.2 customer engagement.zip
  • 1. Importing and Presenting the Database
  • 2. SQL Query Activity by Dates (Part 1)
  • 3. SQL Query Activity by Dates (Part 2)
  • 4. SQL Query Activity by Dates (Part 3)
  • 5. SQL Query Activity by Dates (Part 3).html
  • 6.1 Assignment 1.pdf
  • 6.2 dashboard queries.zip
  • 6.3 tableau datasources.zip
  • 6. Assignment 1.html

  • 12. Building The Dashboard Introduction To Dashboards
  • 1.1 demo dashboard.zip
  • 1. Fixing the Size of the Dashboard
  • 2. The Horizontal, Vertical, and Blank Objects
  • 3. The Text, Image, and Navigation Objects
  • 4. Creating an Item Hierarchy
  • 5. Tiled versus Floating Layout
      14. Building The Dashboard The Engagement And Onboarding Page
    • 1.1 2. engagement - workbook 1.zip
    • 3.1 2. sheet instructions.pdf
    • 3. Assignment 7.html
    • 4.1 2. engagement - workbook 2.zip
    • 5. Assignment 8.html

  • 13. Building The Dashboard The Overview Page
  • 1.1 images.zip
  • 1.2 tableau datasources.zip
  • 1. Creating the KPIs (Part 1)
  • 2. Creating the KPIs (Part 2)
  • 3. Assignment 2.html
  • 4.1 1. overview - workbook 1.zip
  • 4. Horizontal Bar Chart Overall Minutes Watched
  • 5. Formatting the Horizontal Bar Chart
  • 6. Assignment 3.html
  • 7.1 1. overview - workbook 2.zip
  • 7. Swapping Between Charts Using a Parameter
  • 8. Donut Chart Ratings
  • 9. Assignment 4.html
  • 10.1 1. overview - workbook 3.zip
  • 10. Creating the First Page of the Dashboard (Part 1)
  • 11. Assignment 5.html
  • 12. Creating the First Page of the Dashboard (Part 2)
  • 13. Assignment 6.html
  • 14.1 1. overview - workbook 4.zip
  • 14. Creating the First Page of the Dashboard (Part 3)

  • 14. Building The Dashboard The Engagement And Onboarding Page
  • 1.1 2. engagement - workbook 1.zip
  • 1. Line Chart Number of Engaged Students (Choosing the Engagement Period)
  • 2. Line chart Onboarded to Registered Students (Choosing the Engagement Period)
  • 3.1 2. sheet instructions.pdf
  • 3. Assignment 7.html
  • 4.1 2. engagement - workbook 2.zip
  • 4. Line and Bar Charts - Number of Engaged Students (Choosing the Month and Year)
  • 5. Assignment 8.html
  • 6.1 2. engagement - workbook 3.zip
  • 6. Creating the Second Page of the Dashboard
  • 7.1 2. dashboard instructions 1.pdf
  • 7.2 2. dashboard instructions 2.pdf
  • 7.3 2. dashboard instructions 3.pdf
  • 7. Assignment 9.html
  • 8.1 2. engagement - workbook 4.zip
  • 8. Configuring the Navigation Buttons
  • 9. Assignment 10.html

  • 15. Building The Dashboard The Engagement By Cohorts Page
  • 1. What is a Cohort Analysis
  • 2.1 3. cohorts - workbook 1.zip
  • 2.2 student engagement.zip
  • 2. Cohort Tables Retention of Student Engagement
  • 3. Retention Curves Retention of Student Engagement
  • 4.1 3. sheet instructions 1.pdf
  • 4.2 3. sheet instructions 2.pdf
  • 4. Assignment 11.html
  • 5.1 3. cohorts - workbook 2.zip
  • 5. Creating the Third Page of the Dashboard
  • 6.1 3. dashboard instructions.pdf
  • 6. Assignment 12.html
  • 7.1 3. cohorts - workbook 3.zip
  • 7.2 info.zip
  • 7. Creating a Hover Tooltip
  • 8. Assignment 13.html

  • 16. Building The Dashboard The Exams And Certificates Page
  • 1.1 4. exams - workbook 1.zip
  • 1. Horizontal Stacked Bar Chart Number of Exams Attempted
  • 2.1 4. sheet instructions 1.pdf
  • 2. Assignment 14.html
  • 3.1 4. exams - workbook 2.zip
  • 3. Bar Charts Certificates Issuance and Career Track Funnel
  • 4.1 4. sheet instructions 2.pdf
  • 4.2 4. sheet instructions 3.pdf
  • 4. Assignment 15.html
  • 5.1 4. exams - workbook 3.zip
  • 5. Creating the Fourth Page of the Dashboard
  • 6. Assignment 16.html

  • 17. Building The Dashboard The Content Consumption Page
  • 1.1 5. learning - workbook 2.zip
  • 1. Combo Chart F2P Conversion Rate and Subscription Duration.html
  • 2.1 5. learning - workbook 1.zip
  • 2. Combo Charts Minutes Watched and Minutes Watched per User

  • 18. Discussion And Insights
  • 1. Interpreting the Data (Platform Engagement)
  • 2. Interpreting the Data (Onboarding and Retention)
  • 3. Interpreting the Data (Content Consumption)
  • 4. Interpreting the Data (F2P CR and Subscription Duration)
  • 5. Interpreting the Data (Courses Engagement)
  • 6. Interpreting the Data (Exams)
  • 7. Interpreting the Data (Certificates)
  • 8. Further Steps and Improvement
  • 45,900 تومان
    بیش از یک محصول به صورت دانلودی میخواهید؟ محصول را به سبد خرید اضافه کنید.
    خرید دانلودی فوری

    در این روش نیاز به افزودن محصول به سبد خرید و تکمیل اطلاعات نیست و شما پس از وارد کردن ایمیل خود و طی کردن مراحل پرداخت لینک های دریافت محصولات را در ایمیل خود دریافت خواهید کرد.

    ایمیل شما:
    تولید کننده:
    مدرس:
    شناسه: 29384
    حجم: 6081 مگابایت
    مدت زمان: 742 دقیقه
    تاریخ انتشار: 25 دی 1402
    طراحی سایت و خدمات سئو

    45,900 تومان
    افزودن به سبد خرید