وب سایت تخصصی شرکت فرین
دسته بندی دوره ها
1

Microsoft Power BI for Beginners: Get Started with Power BI

سرفصل های دوره

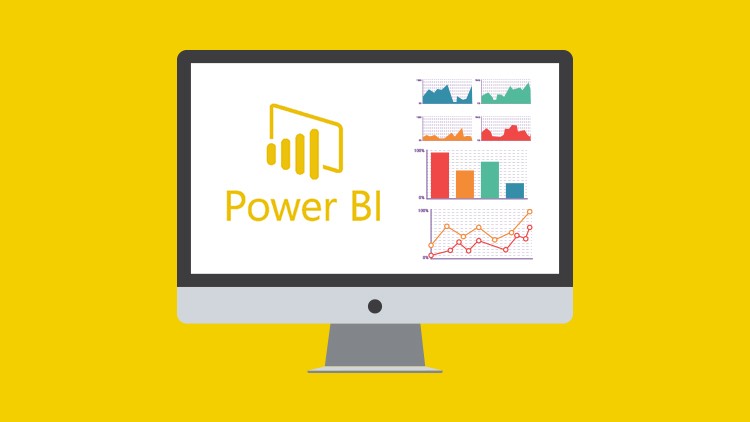
Learn to analyze data and create beautiful dashboards with this Microsoft Power BI beginners course


1 - Introduction
  • 1 - Welcome and Overview
  • 2 - WATCH ME Essential Information for a Successful Training Experience
  • 3 - DOWNLOAD ME Course Demo Files Section 24.html
  • 3 - Power-BI-Course-Demo-Files-section-2-4.zip
  • 4 - DOWNLOAD ME Course Demo Files Section 58.html
  • 4 - Power-BI-Course-Demo-Files-section-5-8.zip
  • 5 - DOWNLOAD ME Course Exercise File.html
  • 5 - Power-BI-Exercise-Files.zip
  • 6 - DOWNLOAD ME Course Transcript.html
  • 6 - Power-BI.pdf
  • 7 - What is Power BI
  • 8 - Install Power BI Desktop
  • 9 - A Tour of BI Desktop
  • 10 - Explore Commonly Used Power BI Options

  • 2 - Getting and Transforming Data
  • 11 - Import Files from a Folder into Power BI Desktop
  • 12 - Get Data from Excel and Text Files
  • 13 - Changing Query Source
  • 14 - Reference Queries to Create Additional Lookup Tables
  • 15 - Merge Queries in Power Query
  • 16 - Prevent Queries from Loading into Power BI Desktop
  • 17 - Practise Exercise

  • 3 - Data Modelling
  • 18 - Create Relationships Between Tables
  • 19 - Create a Dynamic List of Dates
  • 20 - Create Additional Date Columns for Analysis
  • 21 - Sort the Month and Weekday Names Correctly
  • 22 - Mark the Table as a Date Table
  • 23 - Hide Unnecessary Fields from Report View
  • 24 - Practise Exercise

  • 4 - Introduction to DAX Measures
  • 25 - Calculate the Total Revenue
  • 26 - Count the Total Rows of a Table
  • 27 - Use the CALCULATE Function
  • 28 - Calculate the Total Revenue Last Year
  • 29 - Difference Compared to Last Year
  • 30 - Practise Exercise

  • 5 - Adding Visualizations to your Report
  • 31 - Show Summary Information with Cards
  • 32 - Columns Charts to Compare Values
  • 33 - Map Visual to Plot Geographic Data
  • 34 - Slicers to Filter your Reports
  • 35 - KPI Card to Measure Performance Against a Goal
  • 36 - Line Graphs to Visualise Trend
  • 37 - Show Detail with the Matrix
  • 38 - Top N Lists with the Table Visualisation
  • 39 - Practise Exercise

  • 6 - Report Design
  • 40 - Adding Text Boxes and Shapes
  • 41 - Use Themes
  • 42 - Conditional Formatting
  • 43 - Practise Exercise

  • 7 - Editing Interactions and Filters
  • 44 - Edit the Interactions between your Visualisations
  • 45 - The Filter Pane to Filter at Any Level
  • 46 - Drill Through to More Detail
  • 47 - Practise Exercise

  • 8 - Power BI Service
  • 48 - Publish Your Report to the Power BI Service
  • 49 - Different Ways to Share your Power BI Report
  • 50 - Practise Exercise

  • 9 - Closing
  • 51 - Wrap Up
  • 139,000 تومان
    بیش از یک محصول به صورت دانلودی میخواهید؟ محصول را به سبد خرید اضافه کنید.
    افزودن به سبد خرید
    خرید دانلودی فوری

    در این روش نیاز به افزودن محصول به سبد خرید و تکمیل اطلاعات نیست و شما پس از وارد کردن ایمیل خود و طی کردن مراحل پرداخت لینک های دریافت محصولات را در ایمیل خود دریافت خواهید کرد.

    ایمیل شما:
    تولید کننده:
    مدرس:
    شناسه: 1524
    حجم: 2535 مگابایت
    مدت زمان: 248 دقیقه
    تاریخ انتشار: ۲۷ دی ۱۴۰۱
    طراحی سایت و خدمات سئو

    139,000 تومان
    افزودن به سبد خرید