در حال حاضر محصولی در سبد خرید شما وجود ندارد.
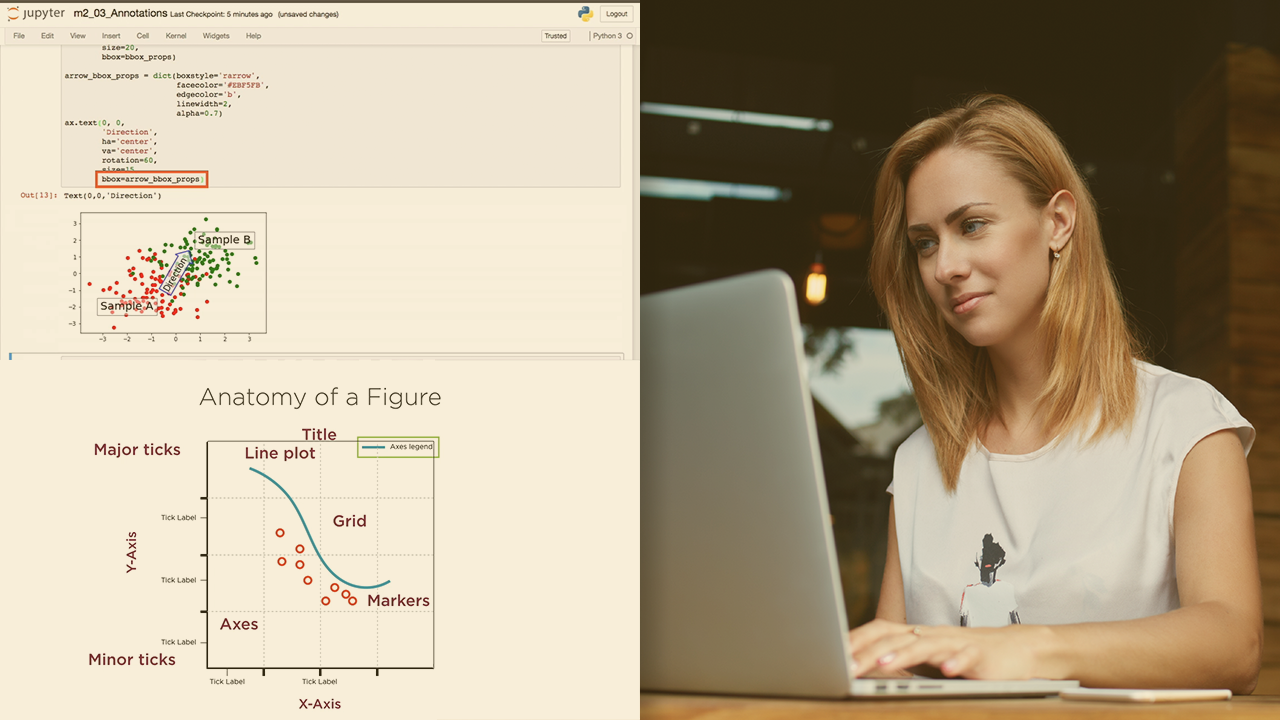
Matplotlib is one of the most popular visualization libraries used by data analysts and data scientists working in Python, but can often be intimidating to use. This course serves to make working with Matplotlib easy and simple.
در این روش نیاز به افزودن محصول به سبد خرید و تکمیل اطلاعات نیست و شما پس از وارد کردن ایمیل خود و طی کردن مراحل پرداخت لینک های دریافت محصولات را در ایمیل خود دریافت خواهید کرد.


Data Validation Techniques in Microsoft Excel
آموزش ساخت و کار با مدل های Deep Learning بوسیله Apache MXNet

Real-time Document Translation with Azure AI Translator

Implementing Machine Learning Workflow with Weka

Applying Differential Equations and Inverse Models with R
آموزش آماده کردن داده ها برای مهندسی آینده و یادگیری ماشینی

Advanced Graph Neural Networks

Experimental Design for Data Analysis
آموزش Deploy کردن راهکارهای یادگیری ماشینی

آموزش معماری راهکارهای بیگ دیتا با استفاده از Google Dataproc

فوری … نیمی از محصولات حذف شد! حذف کامل سایت تا اواسط تیر توضیحات