وب سایت تخصصی شرکت فرین
دسته بندی دوره ها

Formatting ggplot2 Visualization Elements in R

سرفصل های دوره

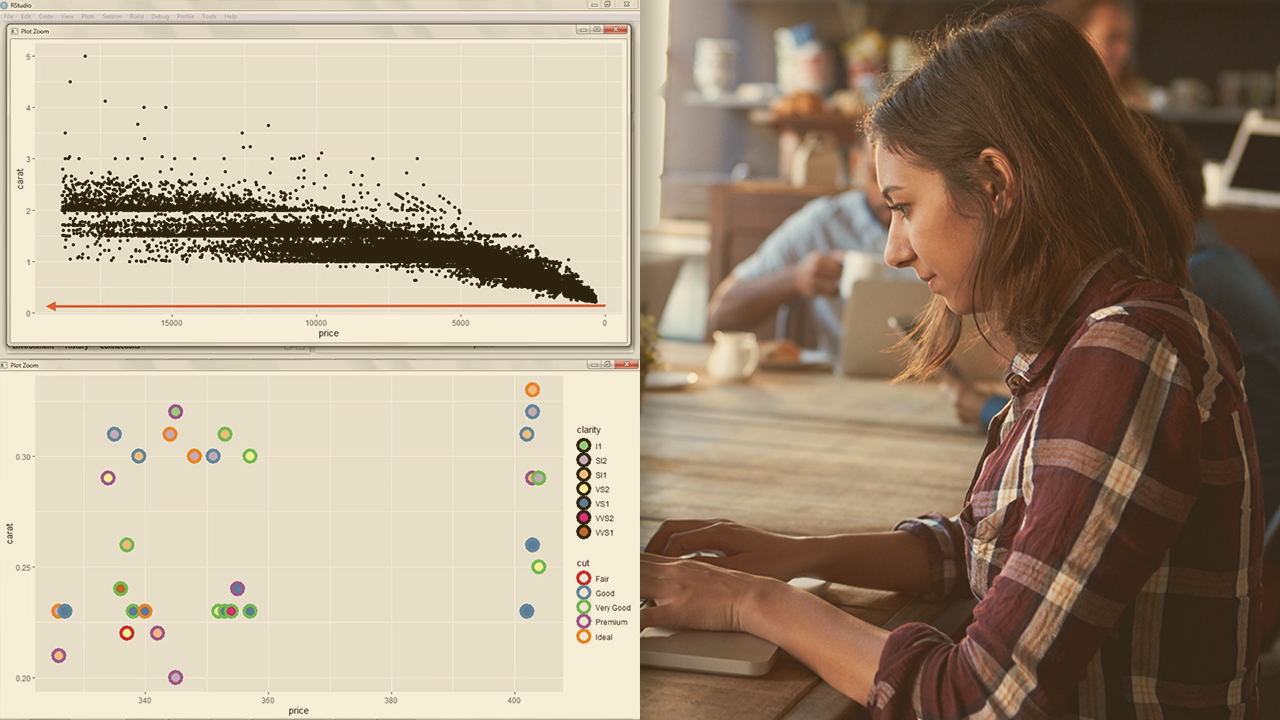
Use the very popular ggplot2 visualization library and learn how to fine tune your charts. Special emphasis is put on color palettes, axes and scales, as well as plot themes.


1. Course Overview
  • 1. Course Overview

  • 2. Understanding a ggplot2 Setup
  • 1. Introduction
  • 2. Managing Expectations
  • 3. General ggplot Setup
  • 4. Geoms - Geometric Objects
  • 5. Titles and Labels
  • 6. Pre-set Themes
  • 7. Faceting and Facet Plots
  • 8. Discretizing Continuous Variables
  • 9. Summary

  • 3. Changing Default Color Settings
  • 1. Intro
  • 2. Manual Color Palettes
  • 3. The R Color Brewer
  • 4. Alternative Color Palettes
  • 5. Color Related Aesthetics
  • 6. A Scatterplot with Color and Fill Effects
  • 7. Summary

  • 4. Working on Plot Axes
  • 1. Intro
  • 2. Underlying Terminology
  • 3. Continuous Scales for Numeric Data
  • 4. Discrete Scales for Categorical Data
  • 5. Helper Functions for Axis Scales
  • 6. Axis Scale Transformations
  • 7. Secondary Axes
  • 8. Building a Climograph
  • 9. Summary

  • 5. Using and Changing Plot Themes in ggplot2
  • 1. Intro
  • 2. Working on Plot Layouts by Using Themes
  • 3. Editing Text Elements
  • 4. Specifying Units of Themes
  • 5. Changing Plot Backgrounds
  • 6. Course Summary
  • 45,900 تومان
    بیش از یک محصول به صورت دانلودی میخواهید؟ محصول را به سبد خرید اضافه کنید.
    خرید دانلودی فوری

    در این روش نیاز به افزودن محصول به سبد خرید و تکمیل اطلاعات نیست و شما پس از وارد کردن ایمیل خود و طی کردن مراحل پرداخت لینک های دریافت محصولات را در ایمیل خود دریافت خواهید کرد.

    ایمیل شما:
    تولید کننده:
    مدرس:
    شناسه: 17348
    حجم: 341 مگابایت
    مدت زمان: 121 دقیقه
    تاریخ انتشار: 13 مرداد 1402
    طراحی سایت و خدمات سئو

    45,900 تومان
    افزودن به سبد خرید