در حال حاضر محصولی در سبد خرید شما وجود ندارد.
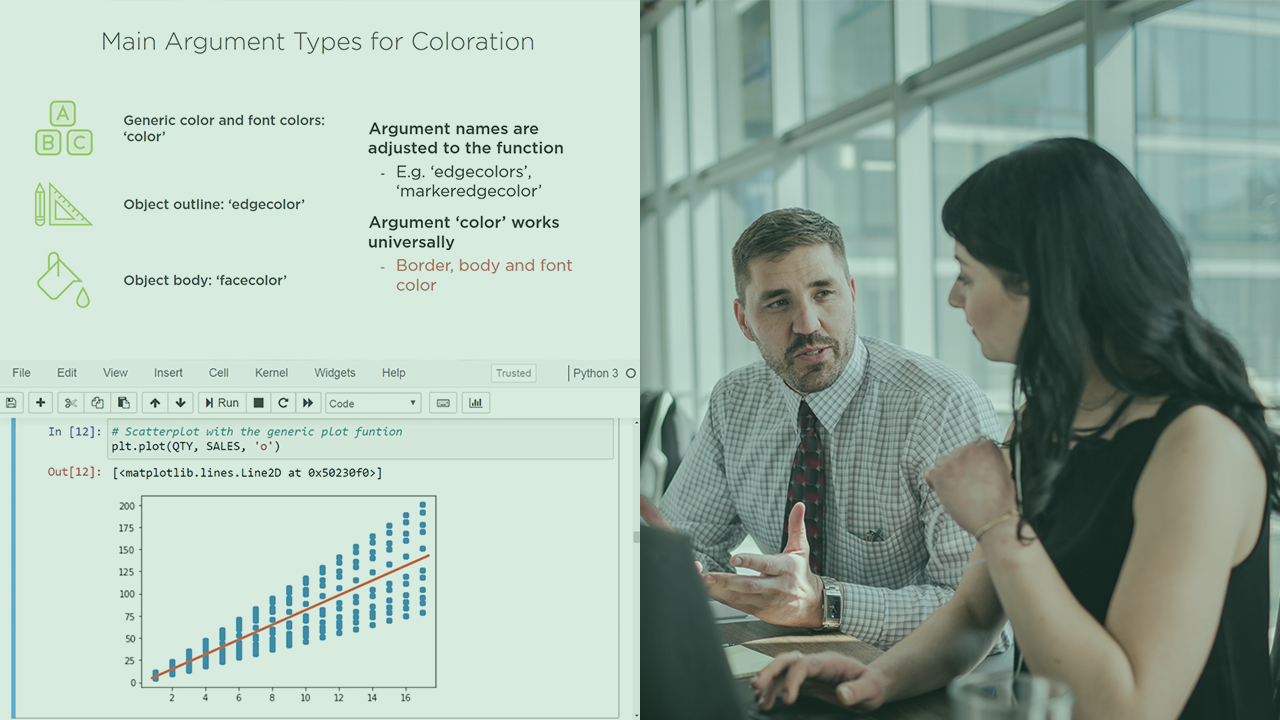
Learn how Matplotlib enables you to create clear and compelling data visualizations in Python.
در این روش نیاز به افزودن محصول به سبد خرید و تکمیل اطلاعات نیست و شما پس از وارد کردن ایمیل خود و طی کردن مراحل پرداخت لینک های دریافت محصولات را در ایمیل خود دریافت خواهید کرد.

آموزش مصورسازی با ggplot2

Annotating ggplot2 Visualizations in R

Exploring Data Visually with R

Managing Data in R Using Data Frames
آموزش مدیریت داده های گم شده ، تکراری یا دارای خطا در R

Exploring Data with Quantitative Techniques Using R

آموزش مرور و کار با مجموعه داده ها در زبان R

Querying and Converting Data Types in R
فیلم یادگیری Exploring Data with Quantitative Techniques Using R
آموزش مدیریت داده ها در R بوسیله Data Frames

فوری … نیمی از محصولات حذف شد! حذف کامل سایت تا اواسط تیر توضیحات