وب سایت تخصصی شرکت فرین
دسته بندی دوره ها

Creating Visualizations Using Base R Graphics

سرفصل های دوره

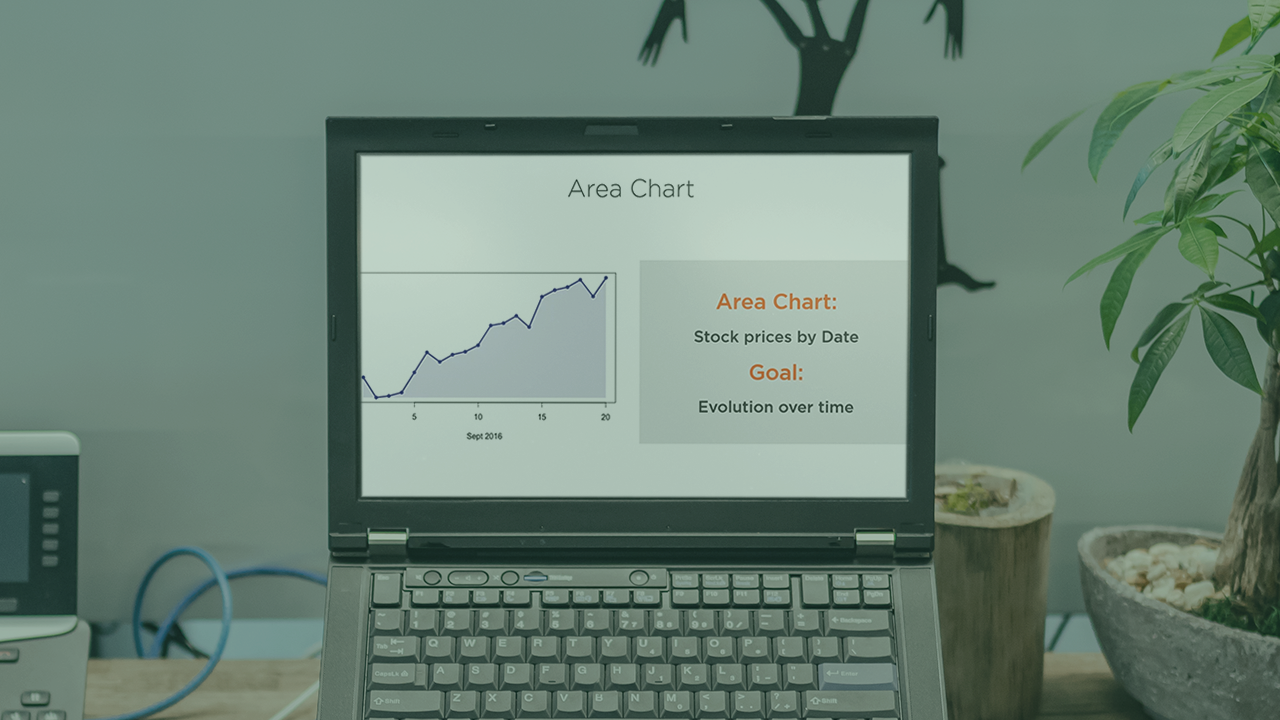
This course will teach you how to create visualizations for a variety of datasets new and old. From bar charts to a histogram and even plotting the function of a line, you will make an impact quickly in businesses and organizations.


1. Course Overview
  • 1. Course Overview

  • 2. Creating Bar Graphs in Base R
  • 1. Introduction, Benefits of Base R, and Datasets
  • 2. Creating a Bar Chart
  • 3. Demo - Bar Chart and Stacked Bar Chart
  • 4. Summary

  • 3. Producing Line and Area Graphs in Base R
  • 1. Introduction and Topics Covered
  • 2. Line Chart
  • 3. Demo - Line Chart
  • 4. Area Chart
  • 5. Demo - Area Chart
  • 6. Summary

  • 4. Creating Statistical Graphs in Base R
  • 1. Introduction
  • 2. Histogram
  • 3. Demo - Histogram
  • 4. Scatter Plot and Plotting a Function of a Line
  • 5. Demo - Scatter Plot and Function of a Line
  • 6. Summary
  • 139,000 تومان
    بیش از یک محصول به صورت دانلودی میخواهید؟ محصول را به سبد خرید اضافه کنید.
    افزودن به سبد خرید
    خرید دانلودی فوری

    در این روش نیاز به افزودن محصول به سبد خرید و تکمیل اطلاعات نیست و شما پس از وارد کردن ایمیل خود و طی کردن مراحل پرداخت لینک های دریافت محصولات را در ایمیل خود دریافت خواهید کرد.

    ایمیل شما:
    تولید کننده:
    شناسه: 17341
    حجم: 71 مگابایت
    مدت زمان: 35 دقیقه
    تاریخ انتشار: ۱۳ مرداد ۱۴۰۲
    طراحی سایت و خدمات سئو

    139,000 تومان
    افزودن به سبد خرید