وب سایت تخصصی شرکت فرین
دسته بندی دوره ها

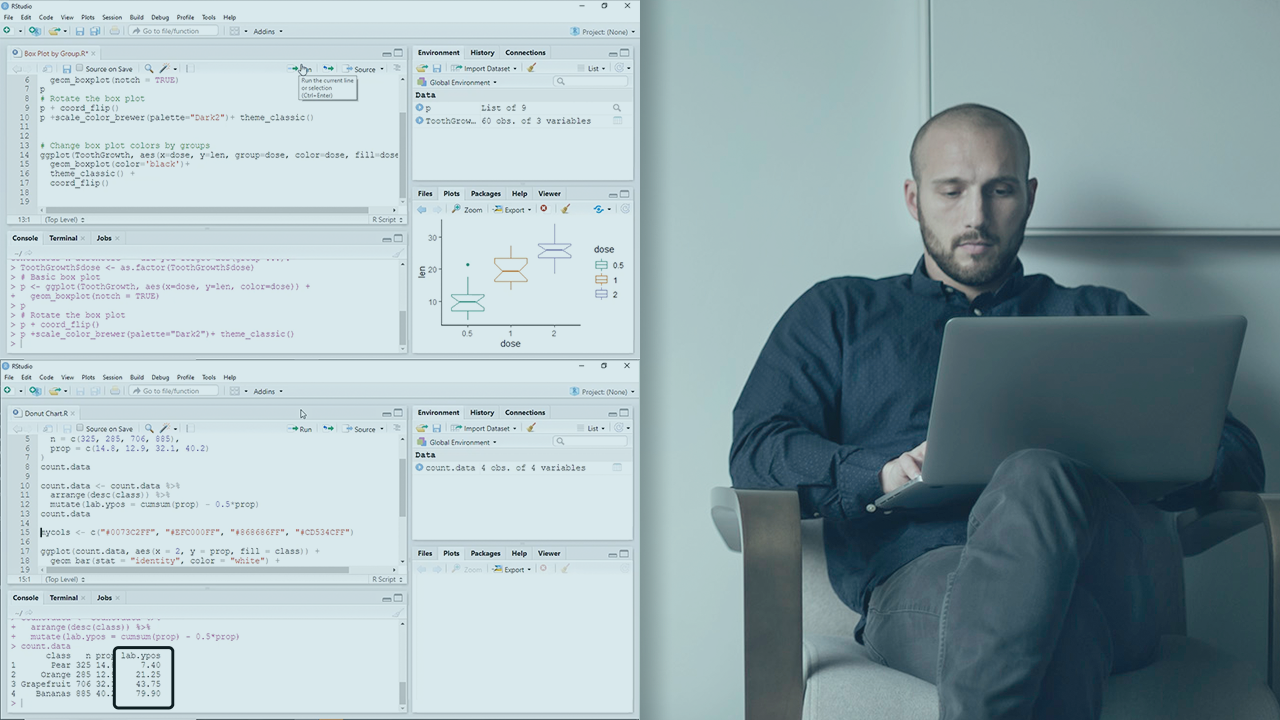
Creating Visualizations in R Using ggplot2: R Playbook

سرفصل های دوره

This course will teach you how to create visualizations for a variety of datasets. From box plots and bar charts to a scatter plot matrix and a geographic map, make an impact efficiently in businesses and organizations.


1. Course Overview
  • 1. Course Overview

  • 2. Leveraging ggplot2 for Creating Graphs
  • 1. Introduction
  • 2. Whats the Difference between ggplot2 and Base R
  • 3. Course Overview and Goals of the Visualizations

  • 3. Showing the Best Plots for One or Two Variables Both Continuous
  • 1. Intro and Overview
  • 3. Demo - Box Plot
  • 5. Demo - Donut Chart
  • 7. Demo - Line Chart
  • 9. Demo - Scatter Plot

  • 4. Producing the Best Plots for Two Variables, One Discrete, and One Continuous
  • 01. Intro and Overview
  • 05. Demo - Bar Chart
  • 09. Demo - Heat Map

  • 5. Creating Graphs with Three or More Variables and Making a Map
  • 1. Intro and Summary
  • 3. Demo - Multi Bar Chart
  • 5. Demo - Facet Grid and Wrap
  • 7. Demo - Scatterplot Matrix
  • 9. Demo - Chloropeth Map
  • 45,900 تومان
    بیش از یک محصول به صورت دانلودی میخواهید؟ محصول را به سبد خرید اضافه کنید.
    خرید دانلودی فوری

    در این روش نیاز به افزودن محصول به سبد خرید و تکمیل اطلاعات نیست و شما پس از وارد کردن ایمیل خود و طی کردن مراحل پرداخت لینک های دریافت محصولات را در ایمیل خود دریافت خواهید کرد.

    ایمیل شما:
    تولید کننده:
    شناسه: 17340
    حجم: 91 مگابایت
    مدت زمان: 40 دقیقه
    تاریخ انتشار: 13 مرداد 1402
    طراحی سایت و خدمات سئو

    45,900 تومان
    افزودن به سبد خرید