در حال حاضر محصولی در سبد خرید شما وجود ندارد.
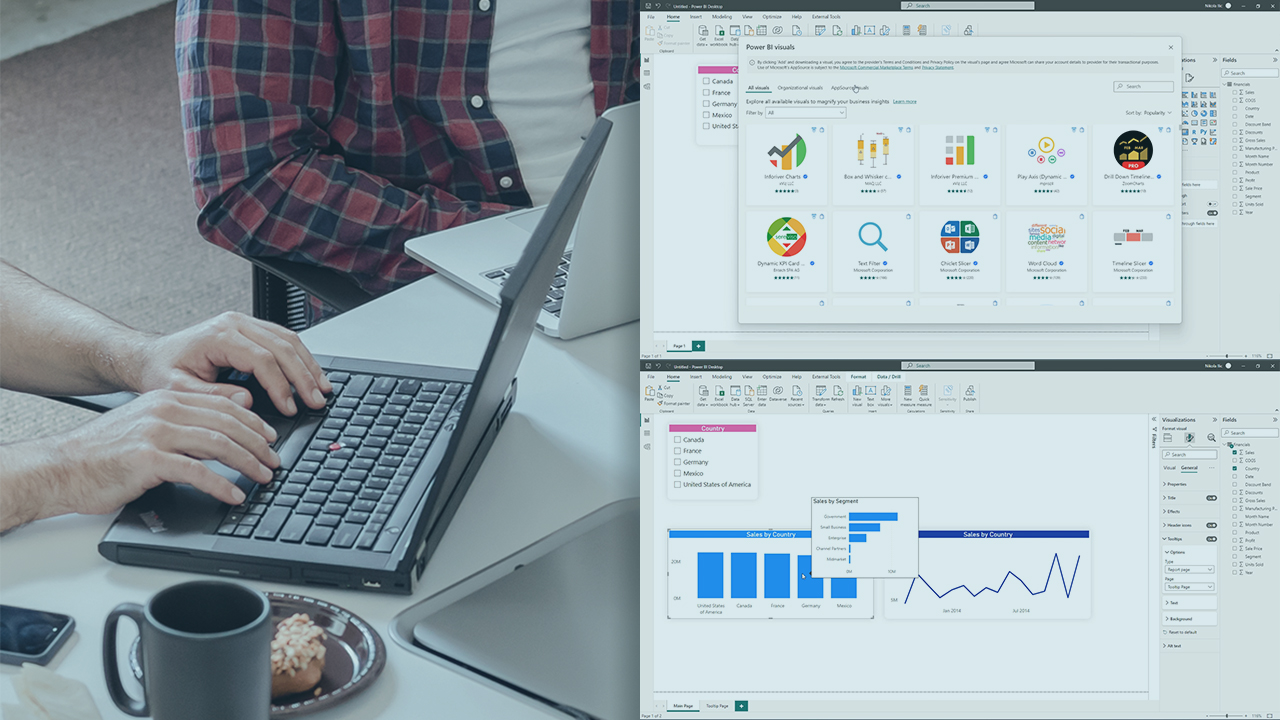
Building a data-driven story is one of the core requirements for effective business decision-making. This course will teach you how to design and configure comprehensive reporting solutions with Microsoft Power BI.
در این روش نیاز به افزودن محصول به سبد خرید و تکمیل اطلاعات نیست و شما پس از وارد کردن ایمیل خود و طی کردن مراحل پرداخت لینک های دریافت محصولات را در ایمیل خود دریافت خواهید کرد.


Understanding Relational Data with Azure
-main-resized.jpg)
طراحی راهکارهای بیزینسی بوسیله Microsoft Power Platform

Data Modeling, Querying, and Reporting for Business Intelligence
بهینه سازی عملکرد مدل با Power BI

Understanding Query Optimization in SQL Server
گزارش سازی بوسیله Power BI

Optimize Model Performance with Power BI

Provisioning Premium Capacity as a Power BI Admin

Configuring Model-driven Applications with Power Apps (PL-400)

فوری … نیمی از محصولات حذف شد! حذف کامل سایت تا اواسط تیر توضیحات