وب سایت تخصصی شرکت فرین
دسته بندی دوره ها

Creating Reports with Power BI

سرفصل های دوره

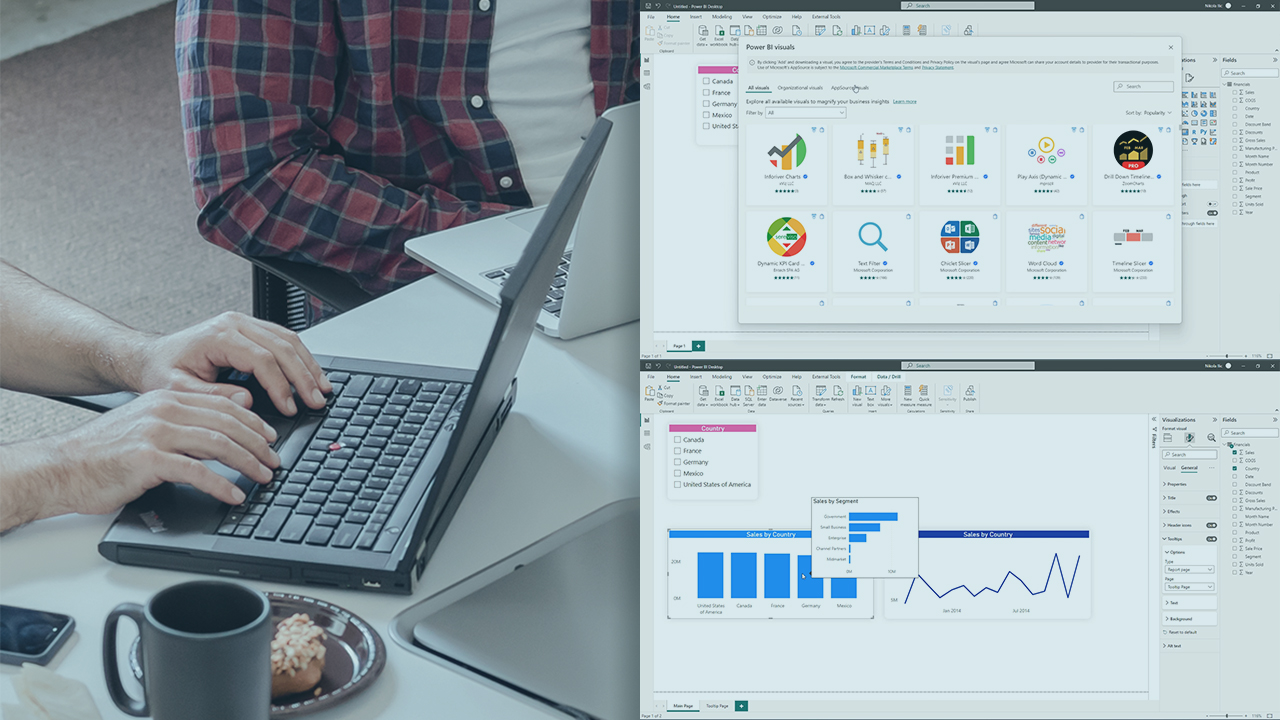
Building a data-driven story is one of the core requirements for effective business decision-making. This course will teach you how to design and configure comprehensive reporting solutions with Microsoft Power BI.


1. Course Overview
  • 1. Course Overview

  • 2. Visualizing Data in Power BI
  • 1. Visualizing Data with Power BI
  • 2. Demo - Visualization Pane in Power BI Desktop
  • 3. Choosing the Appropriate Visualization Type
  • 4. Demo - Import a Custom Visual
  • 5. Configuring and Formatting Visualizations
  • 6. Demo - Format a Clustered Column Chart

  • 03. Configuring Power BI Reports
  • 01. Configuring Power BI Reports
  • 02. Demo - Configuring a Report Page
  • 03. Configuring Automatic Page Refresh
  • 04. Demo - Setting up Automatic Page Refresh
  • 05. Demo - Applying Conditional Formatting
  • 06. Designing Reports for Accessibility
  • 07. Demo - Designing for Accessibility
  • 08. Applying Slicing and Filtering
  • 09. Demo - Applying Slicing and Filtering
  • 10. Demo - Customizing the Report Theme

  • 4. Going beyond with Paginated Reports and Analyze in Excel
  • 1. Introducing Paginated Reports
  • 2. Demo - Integrating Paginated Reports with Power BI
  • 3. Demo - Working with Analyze in Excel
  • 139,000 تومان
    بیش از یک محصول به صورت دانلودی میخواهید؟ محصول را به سبد خرید اضافه کنید.
    افزودن به سبد خرید
    خرید دانلودی فوری

    در این روش نیاز به افزودن محصول به سبد خرید و تکمیل اطلاعات نیست و شما پس از وارد کردن ایمیل خود و طی کردن مراحل پرداخت لینک های دریافت محصولات را در ایمیل خود دریافت خواهید کرد.

    ایمیل شما:
    تولید کننده:
    مدرس:
    شناسه: 30653
    حجم: 150 مگابایت
    مدت زمان: 70 دقیقه
    تاریخ انتشار: ۲ اسفند ۱۴۰۲
    دسته بندی محصول
    طراحی سایت و خدمات سئو

    139,000 تومان
    افزودن به سبد خرید