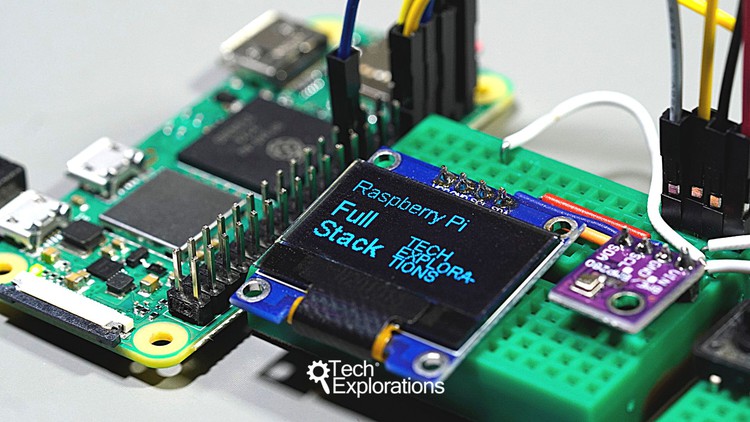
1. 09.05 - Introduction and plan
2.1 env_log.py script (Github).html
2. 09.10 - Capture barometric pressure - local
3.1 The completed script (Github).html
3. 09.15 - Capture barometric pressure - remote
4.1 lab_app.py code (Github).html
4.2 The updated templateslab_temp.html (Github).html
4. 09.20 - Show current local barometric pressure
5.1 lab_app.py.html
5.2 lab_env_db.html.html
5. 09.25 - Show historical barometric pressure
6.1 Plotly documentation website.html
6.2 Plotly Python module (latest version).html
6.3 Plotlys Graph Objects.html
6. 09.30 Upgrade Plotly Part 1 Setup and the Plotly Graph Object
7.1 Entire lab_env_db.html file (on Github).html
7.2 Entire upgraded lab_app.py file (on Github).html
7. 09.31 Upgrade Plotly Part 2 Upgrade implementation
8. 09.40 Show sensor data on OLED Part 1 Plan
9.1 Schedule Python module.html
9.2 The base Python script (GitHub).html
9. 09.41 Show sensor data on OLED Part 2 Setup and base script
10.1 Get the upgraded file oled_mulitfunction_v1.py from Github.html
10.2 Install the ischedule module.html
10. 09.42 Show sensor data on OLED Part 3 Scheduler
11.1 About the Python os module (Python documentation).html
11.2 Copy the oled_multifunction_v2.py from GitHub.html
11.3 RPiFS4 - 09.050 - Show SD available space on OLED (button press)
11. 09.50 - Show SD available space on OLED (button press)
12.1 Systemd configuration file (Github).html
12. 09.60 - OLED display as a service
13.1 Download the KiCad project from Github.html
13. 09.70 - New PCB for the Raspberry Pi
14.1 Download the KiCad project from Github.html
14. 09.80 - New PCB for the ESP32

