در حال حاضر محصولی در سبد خرید شما وجود ندارد.
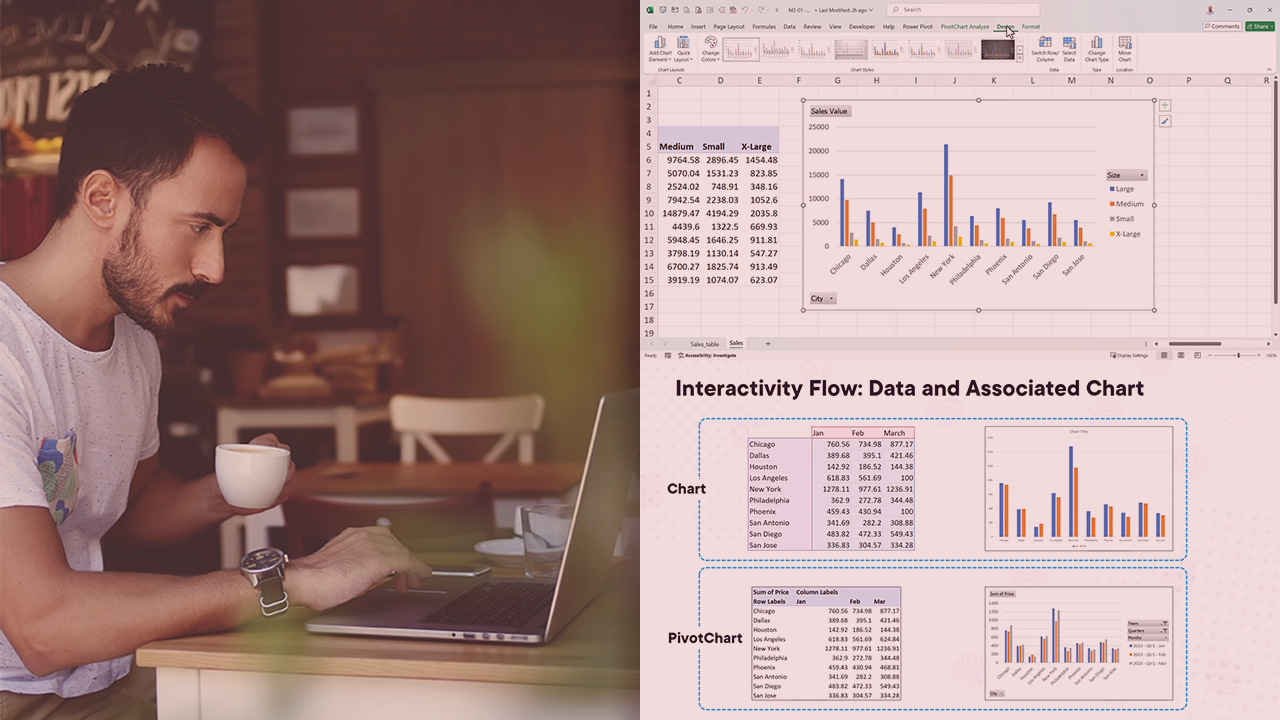
Are you struggling to present data to your colleagues in a meaningful way? This course will teach you how to create and customize PivotCharts, what type of chart should be used in a certain instance, and how to provide interactivity on a chart.
در این روش نیاز به افزودن محصول به سبد خرید و تکمیل اطلاعات نیست و شما پس از وارد کردن ایمیل خود و طی کردن مراحل پرداخت لینک های دریافت محصولات را در ایمیل خود دریافت خواهید کرد.

آموزش جامع کار با نرم افزار Microsoft Project 2019
تجزیه و تحلیل و تجسم داده ها با Power BI

Explore Data with PivotTables in Microsoft Excel

Enhance Reports for Usability and Storytelling with Power BI
آموزش نمایش و کار با جداول در Excel
آموزش به تصویر کشیدن داده ها بوسیله PivotCharts

Usage Monitoring and Auditing as a Power BI Admin
غنی سازی گزارش ها بوسیله Power BI

Displaying Tables with Excel

Data Analysis for Storytelling

✨ تا ۷۰% تخفیف با شارژ کیف پول 🎁
مشاهده پلن ها