وب سایت تخصصی شرکت فرین
دسته بندی دوره ها

Summarizing Data and Deducing Probabilities

سرفصل های دوره

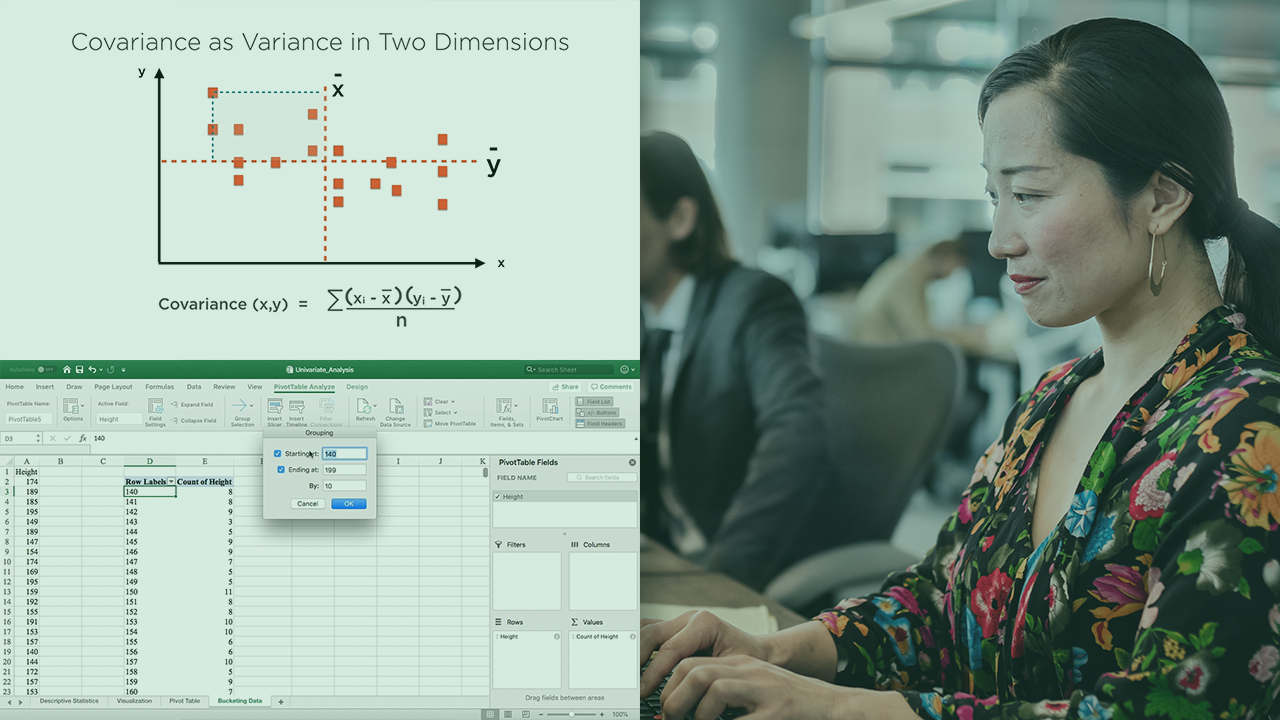
This course covers the most important aspects of exploratory data analysis using different univariate, bivariate, and multivariate statistics from Excel and Python, including the use of Naive Bayes' classifiers and Seaborn to visualize relationships.


01. Course Overview
  • 01. Course Overview

  • 02. Understanding Descriptive Statistics for Data Analysis
  • 02. Module Overview
  • 03. Prerequisites and Course Outline
  • 04. Understanding Descriptive Statistics
  • 05. Measures of Central Tendency and Dispersion
  • 06. Understanding Variance
  • 07. Measuring Relationships Using Covariance
  • 08. Covariance Matrices and Correlation Matrices

  • 03. Performing Exploratory Data Analysis in Spreadsheets
  • 09. Module Overview
  • 10. Working with Excel Workbooks
  • 11. Descriptive Statistics for Univariate Data
  • 12. Visualizing Univariate Statistics
  • 13. Using Pivot Tables for Summary Statistics
  • 14. Performing Analysis Using Bucketing and Pivot Charts
  • 15. Visualizing Bivariate Relationships
  • 16. Performing Regression Analysis on Bivariate Data
  • 17. Covariance and Correlation Matrices for Multivariate Data
  • 18. Visualizing Multivariate Data Using Pivot Charts
  • 19. Regression Analysis with Multivariate Data
  • 20. Module Summary

  • 04. Summarizing Data and Deducing Probabilities Using Python
  • 21. Module Overview
  • 22. Getting Started with Azure Notebooks
  • 23. Calculating Descriptive Statistics Using Python
  • 24. Calculating Descriptive Statistics Using Python Libraries
  • 25. Calculating Skewness Kurtosis and Simple Visualizations
  • 26. Bivariate Analysis
  • 27. Simple Regression on Bivariate Data Using Scipy
  • 28. Regression on Multivariate Data Using Statsmodels and scikit-learn
  • 29. Module Summary

  • 05. Understanding and Applying Bayes Rule
  • 30. Module Overview
  • 31. Intuition behind Bayes Theorem
  • 32. A Priori and Conditional Probabilities to Classify Data
  • 33. Applying Bayes Theorem to Make Predictions
  • 34. Calculating a Priori Probabilities of Survival on the Titanic
  • 35. Applying Bayes Rule Using the Naive Bayes Classifier
  • 36. Module Summary

  • 06. Visualizing Probabilistic and Statistical Data Using Seaborn
  • 37. Module Overview
  • 38. Understanding Kernel Density Estimation
  • 39. Histograms KDE Plots and Rug Plots for Univariate Analysis
  • 40. Scatter Plots Joint Plots Hexbin Plots for Univariate Analysis
  • 41. Regression Analysis on Bivariate Data
  • 42. Representing Pairwise Relationships Using the Pairplot and Pairgrid
  • 43. Visualizing Categorical Data Using Strip Plots and Swarm Plots
  • 44. Visualizing Data Using Box Plots and Violin Plots
  • 45. Visualizing Categorical Data Using Bar Plots Point Plots and Cat Plots
  • 46. Summary and Further Study
  • 45,900 تومان
    بیش از یک محصول به صورت دانلودی میخواهید؟ محصول را به سبد خرید اضافه کنید.
    خرید دانلودی فوری

    در این روش نیاز به افزودن محصول به سبد خرید و تکمیل اطلاعات نیست و شما پس از وارد کردن ایمیل خود و طی کردن مراحل پرداخت لینک های دریافت محصولات را در ایمیل خود دریافت خواهید کرد.

    ایمیل شما:
    تولید کننده:
    مدرس:
    شناسه: 2478
    حجم: 365 مگابایت
    مدت زمان: 171 دقیقه
    تاریخ انتشار: 28 دی 1401
    طراحی سایت و خدمات سئو

    45,900 تومان
    افزودن به سبد خرید