وب سایت تخصصی شرکت فرین
دسته بندی دوره ها

Statistics for Data Science and Business Analysis

سرفصل های دوره

Mastering Statistics Fundamentals using R Programming


1 - Introduction
  • 1 - Introduction
  • 2 - What you will learn in this tutorial.html

  • 2 - R Programming
  • 3 - Why Do We Need R
  • 4 - What Is R and R Studio
  • 5 - R Installation
  • 6 - RStudio Installation
  • 7 - R Studio Interface Console and Help Tab
  • 8 - R Studio Interface File Packages Plot and Environment Tabs
  • 9 - Create a New Project in R
  • 10 - Download Code and Data Files for This Project
  • 10 - RScriptAndData.rar
  • 11 - R Packages
  • 12 - Install a Package in R
  • 13 - Load a Package in R
  • 14 - R Data Sets
  • 15 - Broom in R Studio
  • 16 - Get the Feel of the Data
  • 17 - Get the Feel of the Data View
  • 18 - Get the Feel of the Data glimpse
  • 19 - Types of Variables in R
  • 20 - Types of Variables in R Integers
  • 21 - Types of Variables in R Numerics
  • 22 - Types of Variables in R Factors or Categorical Variables
  • 23 - Types of Variables in R Types of Factors or Categorical Variables
  • 24 - Errors Warnings and Messages
  • 25 - Error Warning and Messages Errors
  • 26 - Error Warning and Messages Information Messages
  • 27 - Error Warning and Messages Warning Messages
  • 28 - Error Warning and Messages A Quick Recap

  • 3 - Subjects in the Population
  • 29 - Subjects in a Population

  • 4 - Statistical Questions
  • 30 - Statistical Questions
  • 31 - Types of Statistical Questions
  • 32 - Descriptive Questions
  • 33 - Comparative Questions
  • 34 - Relationship Questions
  • 35 - Causal Questions
  • 36 - Predictive Questions

  • 5 - Types of Data
  • 37 - Types of Data
  • 38 - Categorical Data
  • 39 - Nominal Categorical Data
  • 40 - Ordinal Categorical Data
  • 41 - Dichotomous Categorical Data
  • 42 - Quantitative Data
  • 43 - Discrete Quantitative Data
  • 44 - Continuous Quantitative Data
  • 45 - Why It Is Important to Classify Variables

  • 6 - Descriptive and Inferential Statistics
  • 46 - Descriptive and Inferential Statistics
  • 47 - Descriptive Statistics
  • 48 - General Social Survey
  • 49 - Real World Example of Descriptive Statistics GSS Survey
  • 50 - Descriptive Statistics for the Entire Population
  • 51 - Inferential Statistics
  • 52 - Sample Statistics and Population Parameters.html

  • 7 - Distribution of a Variable and Frequency Table
  • 53 - Distribution of a variable and Frequency table
  • 54 - Distribution of a Categorical Variable
  • 55 - Frequency Table for Categorical Variables
  • 56 - Understanding Relative Frequency Proportions and Percentages
  • 57 - Distribution of Quantitative Variables
  • 58 - Frequency Table for Discrete Quantitative Variables
  • 59 - Frequency table for discrete Var Hours Per Day Watching TV Limited Outcomes
  • 60 - Frequency table for discrete Var Ideal Number of Kids Limited Outcomes
  • 61 - Frequency table for discrete Var Math Exam Scores Wide Range of Outcomes
  • 62 - Frequency Table Continuous Quantitative Variables
  • 63 - Frequency Table for Continuous Variables Age in Census
  • 64 - Calculate Proportion and Percentages in Excel
  • 65 - Task 1 Frequency Table for Discrete Quantitative Variable in Excel
  • 66 - Task 2 Frequency Table for Categorical Variable in Excel
  • 67 - Titanic Dataset
  • 68 - Loading Titanic Data Set from Excel into R
  • 69 - Getting to Know the Titanic Dataset Exploring Variables
  • 70 - Frequency Table for Categorical Variables in R
  • 71 - Proportions and Percentages in Frequency Table in R
  • 72 - Pipe Operator
  • 73 - Discrete Data
  • 74 - General Social Survey Number of Kids
  • 75 - Recreating GSS Survey Data in Excel Ideal Number of Kids
  • 76 - Frequency Table for Discrete Data 1 Loading Number of Kids Data in R
  • 77 - Frequency Table for Discrete Data 2 Creating a Frequency Table
  • 78 - Frequency Table for Continuous Data 1 Loading Titanic Data In R
  • 79 - Frequency Table for Continuous Data 2 Calculating Range
  • 80 - Frequency Table for Continuous Data 3 Grouping Passengers by Age Group
  • 81 - Frequency Table for Continuous Data 4 LeftClosed and RightOpen Intervals
  • 82 - Frequency Table for Continuous Data 5 Creating a Frequency Table
  • 83 - Frequency Table for Continuous Data 6 Missing Values NAs
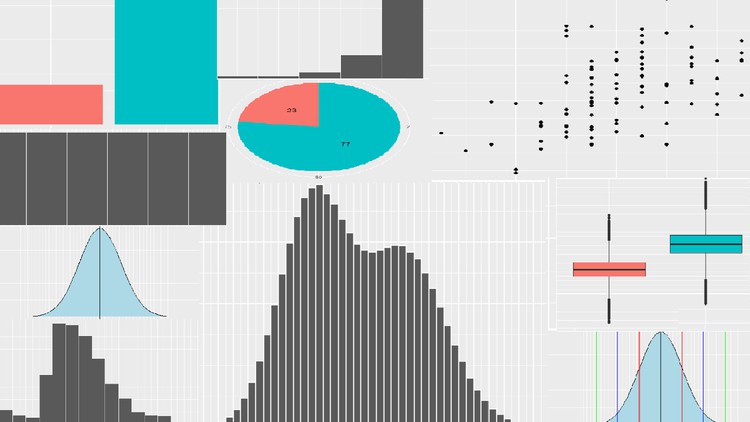
  • 8 - Visualizing the Distribution of a Variable Using Graphs
  • 84 - Graphs
  • 85 - Bar Graph
  • 86 - Pie Chart
  • 87 - Pie Chart in R
  • 88 - Bar graph or Pie chart Article.html
  • 89 - Histogram for a Discrete Variable
  • 90 - Histogram for a Discrete Variable in R
  • 91 - Histogram for a Continuous Variable
  • 92 - Histogram for a Continuous Variable
  • 93 - Histogram for a Continuous Var LeftClosed RightOpen Adjusting Intervals
  • 94 - Histogram for a Continuous Var Dealing with Missing Values
  • 95 - Histogram for a Continuous Var Setting Interval Lengths in a Histogram

  • 9 - The Shape of the Distribution
  • 96 - The Shape of a Distribution
  • 97 - Unimodal Distribution
  • 98 - Symmetric Distribution
  • 99 - Symmetric Distribution of Male Height An Example
  • 100 - Simulating Hypothetical Normal Distribution in R Male Heights
  • 101 - Symmetric Distribution Histogram in R
  • 102 - Skewed Distributions
  • 103 - LeftSkewed Distribution
  • 104 - LeftSkewed Distribution Histogram in R
  • 105 - RightSkewed Distribution
  • 106 - RightSkewed Distribution Histogram in R
  • 107 - Bimodal Distributions
  • 108 - Histogram for Bimodal Distribution
  • 109 - Another Example of Bimodal Distribution
  • 110 - Histogram for Bimodal Distribution 2
  • 111 - Uniform Distribution
  • 112 - Simulating Hypothetical Uniform Distribution in R Dice Output
  • 113 - Histogram for Uniform Distribution

  • 10 - Center of Quantitative Data
  • 114 - Center of Quantitative Data
  • 115 - Mode
  • 116 - Mode in Symmetric Discrete Distribution
  • 117 - Mode in Left Skewed Discrete Distribution
  • 118 - Mode in Right Skewed Discrete Distribution
  • 119 - Mode in Uniform Discrete Distribution
  • 120 - Mode in Categorical Variables
  • 121 - Mean
  • 122 - Calculating Mean in Excel
  • 123 - Impact of Outliers on the Mean
  • 124 - Formula for the MeanArticle.html
  • 125 - Compute Population Mean in R
  • 126 - Compute Sample Mean in R Part 1
  • 127 - Compute Sample Mean in R Part 2
  • 128 - Median
  • 129 - Impact of Outliers on the Median
  • 130 - Formula for Median Article.html
  • 131 - Compute Population Median in R
  • 132 - Compute Sample Median in R
  • 133 - Outliers and Skewed Distributions Article.html
  • 134 - Mean and Median in Symmetric Distribution
  • 135 - Mean and Median in Symmetric Distribution In R
  • 136 - Mean Median in Skewed Distribution Article.html
  • 137 - Mean Median in Right Skewed Distribution In R
  • 138 - Mean Median in Left Skewed Distribution In R
  • 139 - The Mean or Median Article.html

  • 11 - Measuring the Variability of Quantitative Data
  • 140 - What is the Variability
  • 141 - Range
  • 142 - Standard Deviation
  • 143 - Compute Standard Deviation Manually in ExcelPart 1
  • 144 - Compute Standard Deviation Manually in ExcelPart 2
  • 145 - Formula for Population Standard Deviation Article.html
  • 146 - Formula for the Sample Standard Deviation Article.html
  • 147 - Population Standard Deviation In R
  • 148 - Sample Standard Deviation In R
  • 149 - Sample Standard Deviation Formula Recap
  • 150 - Calculate Standard Deviation Manually in R Using n1 Part 1
  • 151 - Calculate Standard Deviation Manually in R Using n1 Part 2
  • 152 - Sample Standard Deviation vs Population Standard Deviation Article.html
  • 153 - n versus n1 Mathematically Article.html
  • 154 - Hypothetical Normal Distribution
  • 155 - Hypothetical Normal Distribution In R
  • 156 - ZScore Article.html

  • 12 - Empirical Rule
  • 157 - Empirical Rule
  • 158 - Empirical Rule in R Part 1
  • 159 - Empirical Rule in R Part 2
  • 160 - Understanding Data Distribution with the Empirical Rule
  • 161 - Outliers in Normal Distributions Article.html
  • 162 - Plausible Value of Standard Deviation Article.html

  • 13 - Percentiles and Quartiles
  • 163 - Percentiles and Quartiles
  • 164 - Percentiles and Quartiles in R
  • 165 - RealLife Usage of Percentiles Growth Charts
  • 166 - RealLife Usage of Percentiles SAT Exams
  • 167 - Making Sense of SAT Scores The Scaling Process Simplified Article.html
  • 168 - 5Number Summary Using Quartiles Article.html
  • 169 - Measuring Variability Using Interquartile Range IQR
  • 170 - Identifying Outliers Using Interquartile Range IQR.html
  • 171 - Boxplot in R
  • 172 - Creating SidebySide Box Plots
  • 173 - Comparing Two Distributions Using Box Plots

  • 14 - Relationship Between Variables
  • 174 - Relationship Between Variables
  • 175 - Response and Explanatory Variables Article.html
  • 176 - Types of Relationship
  • 177 - Relationship Between Two Categorical Variables
  • 178 - Contingency Table
  • 179 - Contingency Table In R
  • 180 - Stacked Bar Plot Article.html
  • 181 - Stacked Bar Plot In R
  • 182 - Relationship between Categorical and Quantitative Variables
  • 183 - Relationship between Two Quantitative Variables
  • 184 - Positive Relationship Article.html
  • 185 - Negative Relationship Article.html
  • 186 - No Relationship Article.html
  • 187 - Scatterplot in R
  • 188 - Correlation Article.html
  • 189 - Correlation In R

  • 15 - Summary
  • 190 - Summary.html
  • 139,000 تومان
    بیش از یک محصول به صورت دانلودی میخواهید؟ محصول را به سبد خرید اضافه کنید.
    افزودن به سبد خرید
    خرید دانلودی فوری

    در این روش نیاز به افزودن محصول به سبد خرید و تکمیل اطلاعات نیست و شما پس از وارد کردن ایمیل خود و طی کردن مراحل پرداخت لینک های دریافت محصولات را در ایمیل خود دریافت خواهید کرد.

    ایمیل شما:
    تولید کننده:
    مدرس:
    شناسه: 37959
    حجم: 1835 مگابایت
    مدت زمان: 322 دقیقه
    تاریخ انتشار: ۶ تیر ۱۴۰۳
    طراحی سایت و خدمات سئو

    139,000 تومان
    افزودن به سبد خرید