وب سایت تخصصی شرکت فرین
دسته بندی دوره ها

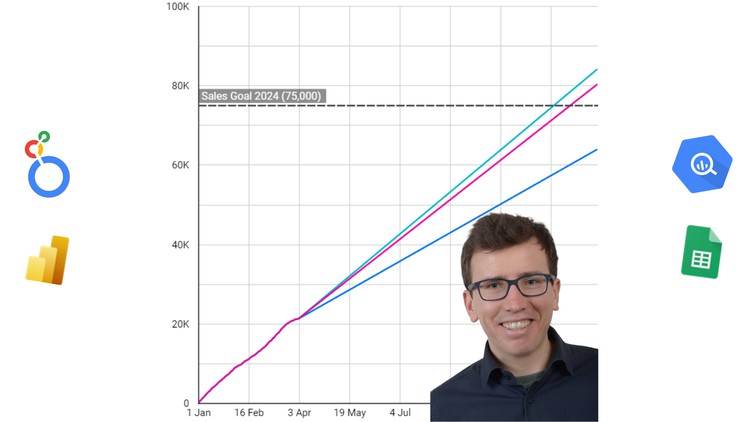
Sales Forecasting Dashboard using Looker, Big Query and SQL

سرفصل های دوره

Create a real world sales-/ marketing forecast model and a goal tracking report that works with minimum data history.


1 - Before we start Prerequisites
  • 1 - Why it is so important to start using predictive analytics for your career
  • 2 - The Solution Overview
  • 3 - Is this course for you
  • 4 - Overview Course Content
  • 5 - Can you do this course without prior knowledge
  • 6 - Why in a real world example time series forecasting based on MLearning fails

  • 2 - Set up Google Big Query
  • 7 - Google Cloud Big Query Account Setup and why its free
  • 8 - Google Cloud and navigating to Google Big Query
  • 9 - Overview Google Big Query and creating the dataset

  • 3 - Example Dataset and loading the data into Google Big Query
  • 10 - Link to the google spreadsheet.txt
  • 10 - Overview and access the data
  • 11 - Overview example data that we want to forecast
  • 12 - Why a separate dimdate table is needed
  • 13 - Loading the data into Google Big Query

  • 4 - Basic SQL Concepts
  • 14 - Introduction
  • 15 - Basic SQL Query
  • 16 - Group Aggregate costs by date Important for your own data
  • 17 - You dont want to have the same date in multiple rows

  • 5 - The SQL Forecast Query
  • 18 - What the Query will do explained in Google Sheets I
  • 19 - What the Query will do explained in Google Sheets II
  • 20 - Forecast-Model-SQL-with-latest-data-yesterday.txt
  • 20 - The Forecast Query in Google Big Query
  • 21 - Forecast-Model-SQL-with-latest-data-yesterday.txt
  • 21 - How to make the Forecast Query work changes you need to make
  • 22 - Running the query and explain the result
  • 23 - Save the query as a view in Google Big Query
  • 24 - Connect the forecast view to looker studio and take a first look
  • 25 - Explore the data and create a calculated field
  • 25 - Forecast-Model-data-studio-formula.txt
  • 26 - Create all forecasts add a budget line change designs
  • 27 - Final thoughts on the forecast model and recommendation on usage
  • 28 - Create all the other forecasts in SQL sales salesvolume

  • 6 - Creating the Forecast Dashboard in Looker Studio
  • 29 - Introduction
  • 30 - Copy the base report
  • 30 - Looker Studio Template.txt
  • 31 - Creating the first Page Manager View and adding a data source
  • 32 - Review of the first page and general dashboard design overview
  • 33 - Second Page 1 Goal Tracking Scribble
  • 34 - Second Page 2 Goal Tracking Start
  • 35 - Second Page 2 Goal Tracking Add the data
  • 36 - Second Page 3 Goal Tracking Actual and Goal Visualization Options
  • 37 - Second Page 4 Goal Tracking Complete the First Forecast Model
  • 38 - Second Page 5 Goal Tracking Complete the second Forecast Model
  • 39 - Second Page 6 Goal Tracking Finalizing
  • 40 - Dashboard Template How to copy the report
  • 40 - Link to the Report Template.txt
  • 40 - person1.zip
  • 40 - person2.zip
  • 40 - untitled-design.zip

  • 7 - How to create the Dashboard in Microsoft Power BI
  • 41 - Power BI Settings and connecting the data
  • 42 - Power BI Explore the data and creating a line chart
  • 43 - Power BI Creating the running sum measures
  • 44 - Power BI Finalizing
  • 44 - forecast-dashboard-power-bi.zip

  • 8 - How to create the forecast dashboard with your own data
  • 45 - Introduction
  • 46 - Tips on how to load your own data into Google Big Query
  • 47 - How to modify your data to make the query work recap of other lectures
  • 139,000 تومان
    بیش از یک محصول به صورت دانلودی میخواهید؟ محصول را به سبد خرید اضافه کنید.
    خرید دانلودی فوری

    در این روش نیاز به افزودن محصول به سبد خرید و تکمیل اطلاعات نیست و شما پس از وارد کردن ایمیل خود و طی کردن مراحل پرداخت لینک های دریافت محصولات را در ایمیل خود دریافت خواهید کرد.

    ایمیل شما:
    تولید کننده:
    مدرس:
    شناسه: 34088
    حجم: 2257 مگابایت
    مدت زمان: 217 دقیقه
    تاریخ انتشار: 29 فروردین 1403
    طراحی سایت و خدمات سئو

    139,000 تومان
    افزودن به سبد خرید