وب سایت تخصصی شرکت فرین
دسته بندی دوره ها

Power BI Data Dashboards

سرفصل های دوره

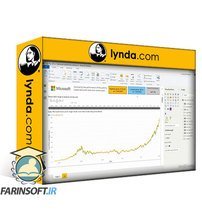
Power BI is a powerful data analytics application for modeling data and creating data visualizations. To truly leverage the power of Power BI, you need to use your visuals impactfully to communicate trends and analysis to make decisions. In this course, data analytics and business analysis expert Helen Wall focuses on the Power BI dashboard, where users interact with charts and graphs that communicate trends in their data. Go over building data dashboards, setting up the Power BI model and ecosystem, and choosing colors. Explore various tools to work with and data and visualize it. Learn ways to compare multiple values, and dive into the mapping options available to you. Find out how to customize tooltips, configure chiclet slicers, display Top N rankings, and more, to put it all together in your own dashboard. To wrap up, learn how to share your work with a phone view, publishing to the Power BI service, and sharing Power BI models.


01 - Introduction
  • 01 - Building data dashboards in Power BI
  • 02 - What you should know
  • 03 - Setting up the Power BI model
  • 04 - Building the Power BI ecosystem
  • 05 - Choosing colors

  • 02 - 1. Working with Data
  • 01 - Configuring table and matrix visuals
  • 02 - Building hierarchies
  • 03 - Creating lists and bins
  • 04 - Applying filters
  • 05 - Building and using DAX formulas
  • 06 - Using quick measures formulas
  • 07 - Formatting visuals
  • 08 - Adding color gradients to heatmaps
  • 09 - Utilizing report themes

  • 03 - 2. Visualizing Data
  • 01 - Visualizing time-intelligence trends
  • 02 - Using column charts to visualize trends
  • 03 - Ranking categorical totals
  • 04 - Comparing proportions
  • 05 - Setting up histograms
  • 06 - Utilizing scatter plots
  • 07 - Challenge Visualizing data
  • 08 - Solution Visualizing data

  • 04 - 3. Comparing Multiple Variables
  • 01 - Analytics options Reference, trend, and forecast lines
  • 02 - Creating sparklines to quickly view trends
  • 03 - Leveraging box plots and violin plots
  • 04 - Visualizing flows with Sankey charts
  • 05 - Examining key performance indicators (KPIs)
  • 06 - Challenge Analyzing multiple variables
  • 07 - Solution Analyzing multiple variables

  • 05 - 4. Mapping Options
  • 01 - Shape map visual
  • 02 - Shape map visual
  • 03 - Drilling through map levels
  • 04 - Mapping flow patterns
  • 05 - Challenge Map visuals
  • 06 - Solution Map visuals

  • 06 - 5. Putting It All Together
  • 01 - Customing tooltips
  • 02 - Configuring chiclet slicers
  • 03 - Displaying Top N rankings
  • 04 - Syncing slicers between pages
  • 05 - Creating dashboards
  • 06 - Adding nudge prompts to promote interactions

  • 07 - 6. Sharing Your Work
  • 01 - Creating a phone view
  • 02 - Publishing to Power BI service
  • 03 - Sharing Power BI models

  • 08 - Conclusion
  • 01 - Getting more out of Power BI
  • 139,000 تومان
    بیش از یک محصول به صورت دانلودی میخواهید؟ محصول را به سبد خرید اضافه کنید.
    خرید دانلودی فوری

    در این روش نیاز به افزودن محصول به سبد خرید و تکمیل اطلاعات نیست و شما پس از وارد کردن ایمیل خود و طی کردن مراحل پرداخت لینک های دریافت محصولات را در ایمیل خود دریافت خواهید کرد.

    ایمیل شما:
    تولید کننده:
    مدرس:
    شناسه: 20496
    حجم: 371 مگابایت
    مدت زمان: 145 دقیقه
    تاریخ انتشار: ۱۵ مهر ۱۴۰۲
    طراحی سایت و خدمات سئو

    139,000 تومان
    افزودن به سبد خرید