وب سایت تخصصی شرکت فرین
دسته بندی دوره ها

Mastering Microsoft Power BI Unleashing Insights – AIML

سرفصل های دوره

1. Empowering Your Business with Power BI An Introduction to Unlocking Intentional
  • 1. Unlocking Data Insights An Introduction to Power BI
  • 2. Demystifying Data Harnessing Power BI for Insightful Analytics
  • 3. Mastering Data Visualization From Basic Charts to Power BI
  • 4. Exploring Data with Bar and Stacked Bar Charts
  • 5. Visualizing Data with Pie Charts A Deeper Slice
  • 6. Exploring Data Trends with Ribbon Plots

  • 2. Exploring India's COVID-19 Data Through Interactive Bubble Maps & Custom Bubble
  • 1. Table Manipulation and Enhancement in Power BI Tools and Techniques
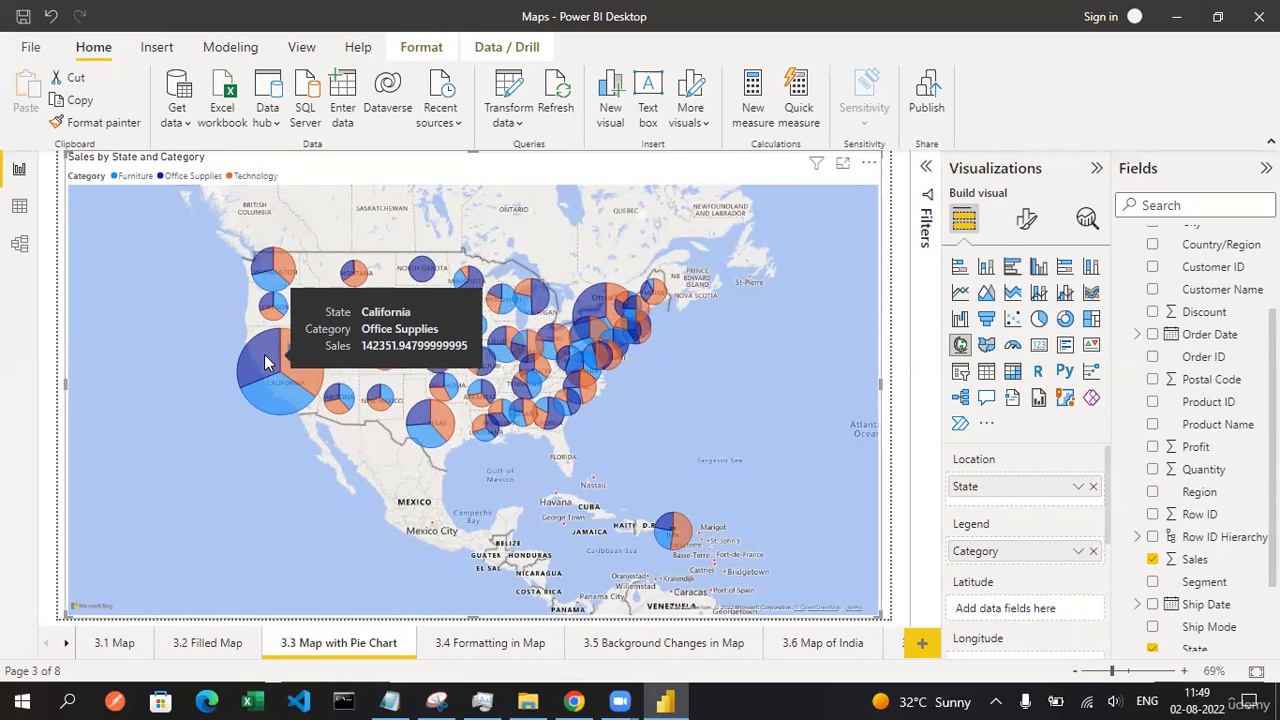
  • 2. Exploring Geographic Insights Power BI Mapping Tools
  • 3. Enhancing Geo-spatial Insights Power BI Maps with Bubbles Tools
  • 4. Enhancing Visual Appeal in Power BI Formatting Maps
  • 5. Unleashing the Power of Custom Maps in Power BI A Comprehensive Guide
  • 6. Harnessing the Power of Data Analyzing the Impact of COVID-19 in India
  • 7. Unveiling Insights Analyzing the Impact of COVID-19 in India Using Power BI

  • 3. Mastering Power BI Unleashing the Power of Tables, Formatting, Cards etc
  • 1. Table Transformation Techniques in Power BI The Fundamentals
  • 2. Beyond the Basics Exploring Advanced Conditional Formatting in Power BI
  • 3. Hierarchy Hacks Optimizing Power BI for Hierarchical Data Structures
  • 4. Mastering Conditional Matrix Formatting in Power BI Unleash the Power of Visual
  • 5. Unlocking Insights with Power BI Number Cards Visualizing Data at a Glance
  • 6. Designing Effective Power BI Text and Data Cards Best Practices and Tips
  • 7. Enhancing Data Storytelling with Multi-Row Cards
  • 8. Leveraging Power BI Filters A Comprehensive Exploration and Explanation
  • 9. Unraveling Data Insights with Power BI From Exploratory Data Analysis (EDA)
  • 4. Enhancing Power BI Reports Text Slicers, Format Cells, Number Slicers, Basic UI
  • 1. Unlocking Data Insights Mastering Power BI Text Slicers for Enhanced Visualizat
  • 2. Leveraging Power BI Mastering Text Slicers for Data Visualization
  • 3. Mastering Number Slicers Unlocking the Full Potential of Power BI Formatting
  • 4. Unlocking Data Insights A Deep Dive into Power BI Dashboards
  • 5. Unlocking Sales Insights A Deep Dive into the Power BI Sales Summary Analysis D
  • 6. Visualizing Sales Data for Actionable Insights Power BI Sales Summary Dashboard

  • 5. Getting Started with Power BI Introduction to Data Transformation in the UI
  • 1. Preparing Your Data for Visualization Power BI Transformation Basics
  • 2. Data Preparation and Transformation in Power BI A Primer
  • 3. The Power of Transformation An Introduction to Power BI
  • 4. Transforming Your Data for Analysis Power BI Fundamentals
  • 5. Exploring Data Transformation in Power BI A Beginners Guide
  • 6. Mastering Data Transformation An Introductory Guide to Power BI

  • 6. Exploring Data Transformation in Power BI with Power Query
  • 1. Data Transformation with Power Query
  • 2. Optimizing Data Sources Power Query Deep Dive
  • 3. Power Query Your Gateway to Data Transformation
  • 4. Custom Column Creation in Power Query
  • 5. Advanced Data Transformation with Power Query
  • 6. Data Merging and Joining with Power Query

  • 7. Date and Time Intelligence Module for Power BI
  • 1. Harnessing Date Functions for Advanced Analytics in Power BI
  • 2. Time-Based Insights Using Date Functions in Power BI
  • 3. From Dates to Insights Leveraging Power BIs Date Functions
  • 4. Optimizing Data Analysis with Power BIs Date Functions
  • 5. Deep Dive into Date Functions Power BIs Secret Weapon

  • 8. Sales Insights Visualizing Data for Decision-Making and Exploring Sales Trends
  • 1. Sales Performance Dashboard A Visual Overview
  • 2. Unlocking Sales Data Power BI Visualization Showcase
  • 3. Driving Sales Strategy Power BI Visualization Examples
  • 4. Sales Analytics Dashboard Charting Success in Power BI
  • 5. Power BI Sales Dashboard Unveiling the Visual Story
  • 6. Mastering Sales Visualization A Power BI Showcase

  • 9. Creating a Visual Sales Narrative Power BI for Production Analysis
  • 1. Sales Dashboard Mastery Power BI Visualizations in Action
  • 2. Unlocking Sales Insights A Power BI Visualization Project
  • 3. Driving Growth Sales Production Analysis Using Power BI Visualizations
  • 4. Data-Driven Decision Making Sales Analysis with Power BI Plots
  • 5. Driving Sales Strategy through Visualization & Unlocking Sales Insights
  • 6. Analyzing Sales Data with Power BI Charts & Productivity Analysis Through Visual
  • 139,000 تومان
    بیش از یک محصول به صورت دانلودی میخواهید؟ محصول را به سبد خرید اضافه کنید.
    خرید دانلودی فوری

    در این روش نیاز به افزودن محصول به سبد خرید و تکمیل اطلاعات نیست و شما پس از وارد کردن ایمیل خود و طی کردن مراحل پرداخت لینک های دریافت محصولات را در ایمیل خود دریافت خواهید کرد.

    ایمیل شما:
    تولید کننده:
    شناسه: 24649
    حجم: 1880 مگابایت
    مدت زمان: 211 دقیقه
    تاریخ انتشار: 21 آذر 1402
    طراحی سایت و خدمات سئو

    139,000 تومان
    افزودن به سبد خرید