در حال حاضر محصولی در سبد خرید شما وجود ندارد.
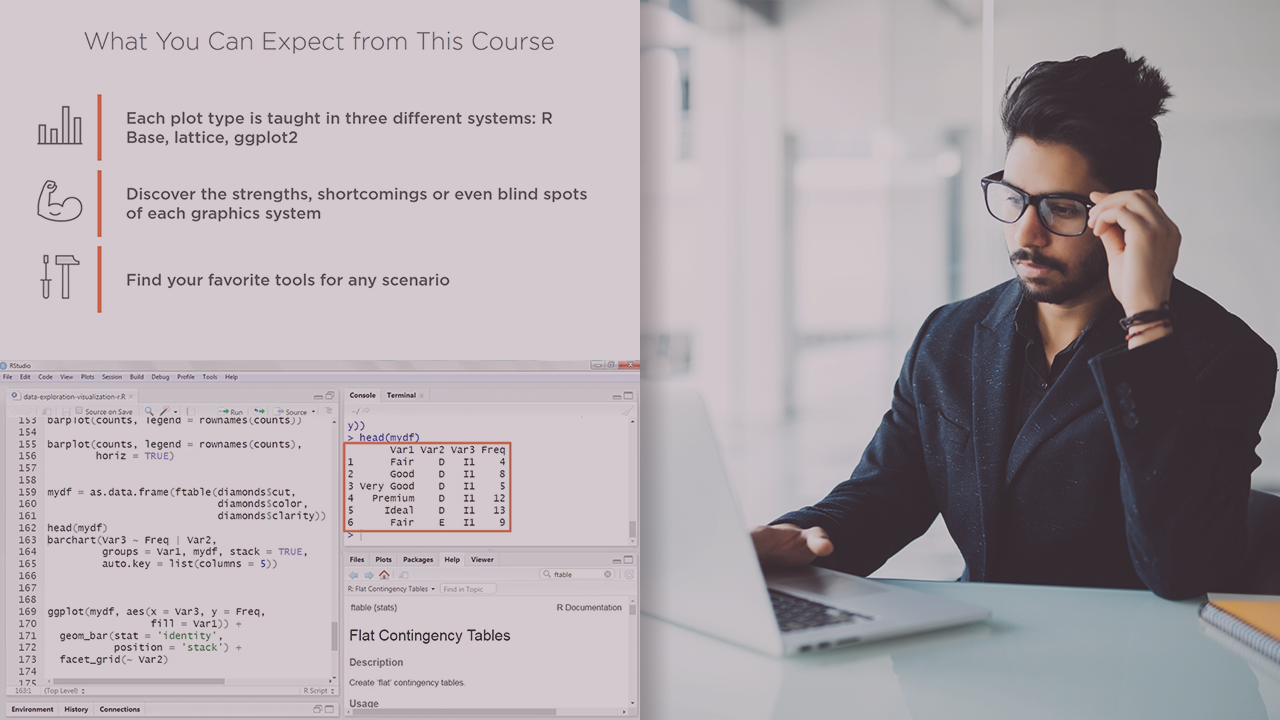
Learn how to use data visualizations like scatterplots, barcharts, histograms, and boxplots for data exploration.
در این روش نیاز به افزودن محصول به سبد خرید و تکمیل اطلاعات نیست و شما پس از وارد کردن ایمیل خود و طی کردن مراحل پرداخت لینک های دریافت محصولات را در ایمیل خود دریافت خواهید کرد.

آموزش مرور و کار با داده ها به صورت مصور در R

Exploring Your First Data Set with R
آموزش مدیریت داده های گم شده ، تکراری یا دارای خطا در R
آموزش Query گرفتن و تبدیل انواع داده ها در R

Manipulating String Data in R
آموزش مصورسازی با ggplot2
آموزش مدیریت داده ها در R بوسیله Data Frames

Exploring Data with Quantitative Techniques Using R
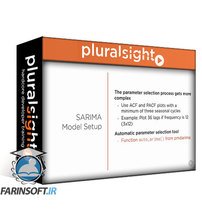
آموزش داده یابی از سری های زمانی

Build Your First Data Visualization with Matplotlib

فوری … نیمی از محصولات حذف شد! حذف کامل سایت تا اواسط تیر توضیحات