وب سایت تخصصی شرکت فرین
دسته بندی دوره ها

Communicating Data Insights

سرفصل های دوره

This course covers the key statistical and technical tools needed to convey clear, actionable insights from data to senior executives, including the use of powerful visualizations such as Sankey diagrams, funnel plots and candlestick plots.


1. Course Overview
  • 1. Course Overview

  • 2. Communicating Insights from Statistical Data
  • 01. Version Check
  • 02. Module Overview
  • 03. Prerequisites and Course Outline
  • 04. Visualizations and Use Cases
  • 05. Getting Started with Azure Notebooks
  • 06. Visualizing Statistical Data
  • 07. Box Plots and Violin Plots
  • 08. Histograms
  • 09. Pie Charts
  • 10. Visualizing Autocorrelation
  • 11. Stacked Plots and Stem Plots
  • 12. Summary

  • 3. Communicating Insights from Business Data
  • 01. Module Overview
  • 02. Loading XML Data
  • 03. Bubble Charts
  • 04. Bubble Maps for Geographical Data
  • 05. Heatmaps
  • 06. Interactive Time Series Charts
  • 07. Candlestick Charts for Stock Price Movements
  • 08. Funnel Charts and SVG Paths
  • 09. Drawing Funnel Charts
  • 10. Sankey Diagrams
  • 11. Summary

  • 4. Visualizing Distributions and Relationships in Data
  • 1. Module Overview
  • 2. Visualizing Univariate Distributions
  • 3. Visualizing Bivariate Relationships
  • 4. Pairwise Relationships
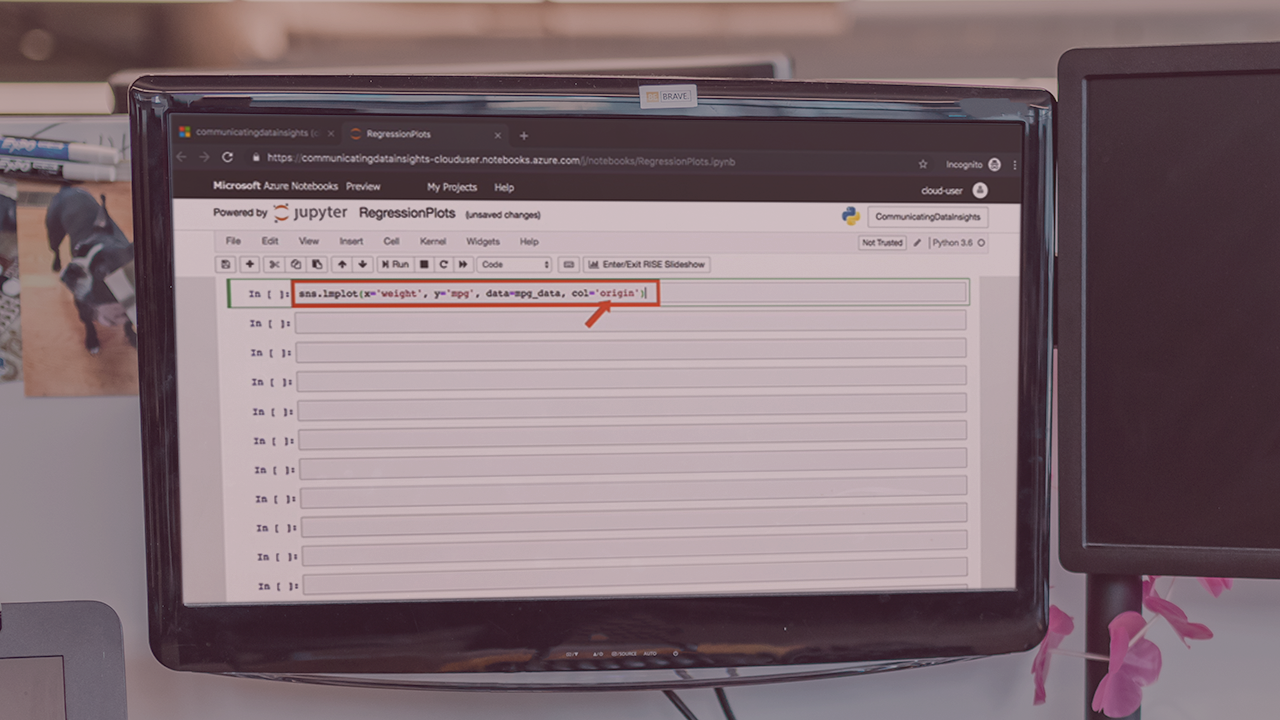
  • 5. Regression Plots
  • 6. Strip Plots and Swarm Plots
  • 7. Box Plots, Violin Plots, and Factor Plots
  • 8. Module Summary

  • 5. Integrating Data in a Multi-cloud Environment
  • 1. Module Overview
  • 2. Data Silos and Possible Solutions to Silos
  • 3. Setting up an Azure SQL Data Warehouse
  • 4. Uploading a File to Azure Blob Storage
  • 5. Loading Data from Blob Storage to SQL Warehouse Using Azure Data Factory
  • 6. Loading Data from S3 Buckets to the SQL Data Warehouse
  • 7. Summary

  • 6. Integrating Data in a Hybrid Environment
  • 1. Module Overview
  • 2. Loading Data to an On-premises SQL Server
  • 3. Configuring a Self-hosted Integration Runtime
  • 4. Copying Data from On-premises SQL Server to SQL Data Warehouse
  • 5. Visualizing Data Using Power BI
  • 6. Summary and Further Study
  • 45,900 تومان
    بیش از یک محصول به صورت دانلودی میخواهید؟ محصول را به سبد خرید اضافه کنید.
    خرید دانلودی فوری

    در این روش نیاز به افزودن محصول به سبد خرید و تکمیل اطلاعات نیست و شما پس از وارد کردن ایمیل خود و طی کردن مراحل پرداخت لینک های دریافت محصولات را در ایمیل خود دریافت خواهید کرد.

    ایمیل شما:
    تولید کننده:
    مدرس:
    شناسه: 2434
    حجم: 340 مگابایت
    مدت زمان: 148 دقیقه
    تاریخ انتشار: 28 دی 1401
    طراحی سایت و خدمات سئو

    45,900 تومان
    افزودن به سبد خرید