وب سایت تخصصی شرکت فرین
دسته بندی دوره ها

Chart js 4 Creating Perfect Charts [ Tips and tricks ]

سرفصل های دوره

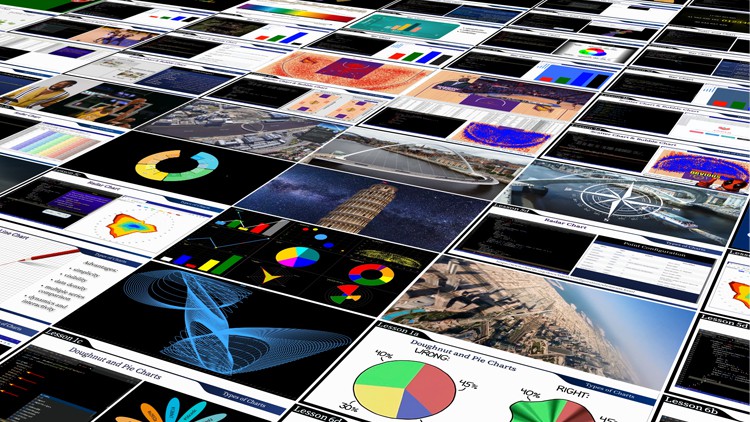
Chart.js Learn how to build dynamic and interactive graphs, charts, and diagram using Chart js v.4 [ Theory & Practice ]


1. Basic Concepts
  • 1.1 Chapter 1 Lesson 1.zip
  • 1. Preparation [Setting Up Your Environment]
  • 2. 3 Steps to create a chart with chart.js library
  • 3. The basic scenario of creating a chart
  • 4. Inspecting a chart object
  • 5. The arsenal of the chart js library in terms of chart variety
  • 6. The additional configuration sections

  • 2. Doughnut and Pie Charts [The interactive chart Visualizing the Seasons]
  • 1. Introduction. Historical background.
  • 2.1 Chapter 2 Lesson 1.zip
  • 2. Html structure, css styles, the simplest kind of graphics in JavaScript
  • 3. Additional properties, datasets
  • 4. Fine-tuning [options, plugins, hover effects]

  • 3. PolarArea chart. Dynamics. [Unlocking the Secrets of Pi
  • 1.1 Chapter 3 Lesson 1.zip
  • 1. General information. Problem statement. Structure of html
  • 2. Preparing a template to display the graph.
  • 3. Parsing and preparation of data for dynamical charting
  • 4. Development of a mechanism for updating the dynamic chart
  • 5. Acceleration. The Secret of Pi. Conclusions.

  • 4. Bar Chart [Interactive work with colors]
  • 1.1 Chapter 4 Lesson 1.zip
  • 1. Introduction. HTML & CSS setup
  • 2. Customize the initial appearance and of the chart.
  • 3. Linking sliders to the chart. Update.
  • 4. Fine-tuning the chart

  • 5. Bubble Chart & Scatter Chart [Statistical chart of shots in basketball]
  • 1.1 Chapter 5 Lesson 1.zip
  • 1. Introduction. HTML structure.
  • 2. Events. Overview of the structure. Canvas setup.
  • 3. Building the method of reading and parsing the source data. Source chart.
  • 4. Precise positioning of the background. Adjustment of axes. Data selection.
  • 5. Use of hyperlinks. Statistics for experiments. Conclusion.

  • 6. Radar Chart [Wind Rose]
  • 1.1 Chapter 6 Lesson 1.zip
  • 1. Introduction, general information. Project composition, Html setup.
  • 2. Analyzing the structure of the original data. Collection and processing.
  • 3. Build the initial view of the chart and initial setup.
  • 4. Fine-tune the appearance of the chart.
  • 5. A few finishing touches. Assignments for independent work.

  • 7. Line Chart [Exploring Dynamic Graphs of Functions]
  • 1.1 Chapter 7 Lesson 1.zip
  • 1. Introduction. HTML structure.
  • 2. The overall structure of the module. Events. Initial view of the chart.
  • 3. Work on dynamics and animation. Control methods.
  • 4. Methods of customizing the chart view. Alternative animation option.
  • 5. Drawing on top of the chart using custom plugins.
  • 45,900 تومان
    بیش از یک محصول به صورت دانلودی میخواهید؟ محصول را به سبد خرید اضافه کنید.
    خرید دانلودی فوری

    در این روش نیاز به افزودن محصول به سبد خرید و تکمیل اطلاعات نیست و شما پس از وارد کردن ایمیل خود و طی کردن مراحل پرداخت لینک های دریافت محصولات را در ایمیل خود دریافت خواهید کرد.

    ایمیل شما:
    تولید کننده:
    مدرس:
    شناسه: 23870
    حجم: 1344 مگابایت
    مدت زمان: 151 دقیقه
    تاریخ انتشار: 12 آذر 1402
    دیگر آموزش های این مدرس
    طراحی سایت و خدمات سئو

    45,900 تومان
    افزودن به سبد خرید