در حال حاضر محصولی در سبد خرید شما وجود ندارد.
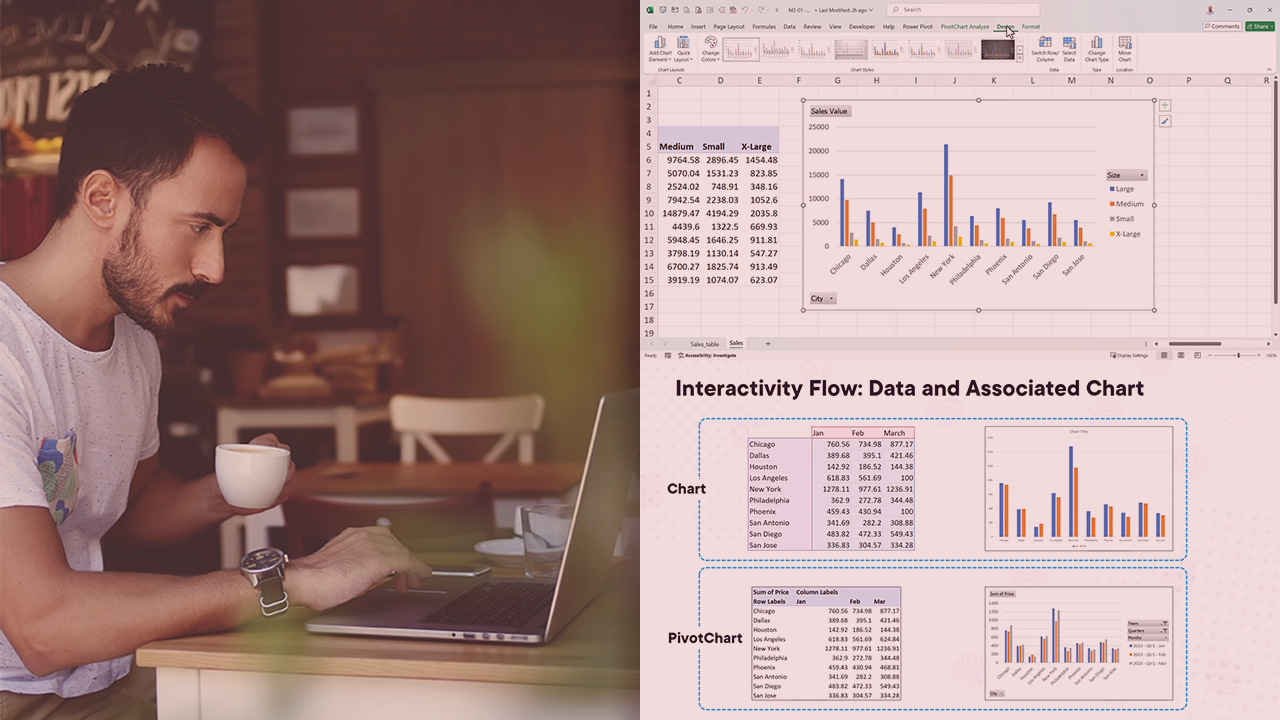
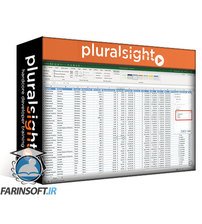
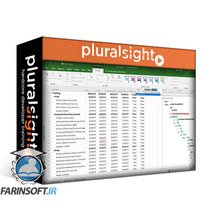
Are you struggling to present data to your colleagues in a meaningful way? This course will teach you how to create and customize PivotCharts, what type of chart should be used in a certain instance, and how to provide interactivity on a chart.
در این روش نیاز به افزودن محصول به سبد خرید و تکمیل اطلاعات نیست و شما پس از وارد کردن ایمیل خود و طی کردن مراحل پرداخت لینک های دریافت محصولات را در ایمیل خود دریافت خواهید کرد.

آموزش خلاصه سازی و سازمان دهی داده ها در اکسل

Explore Data with PivotTables in Microsoft Excel
آموزش به تصویر کشیدن داده ها بوسیله PivotCharts

آموزش مرور و کار با داده ها در اکسل بوسیله PivotTables
آموزش نمایش و کار با جداول در Excel

Usage Monitoring and Auditing as a Power BI Admin

Displaying Tables with Excel

Enhance Reports for Usability and Storytelling with Power BI
غنی سازی گزارش ها بوسیله Power BI
آموزش جامع کار با نرم افزار Microsoft Project 2019
