در حال حاضر محصولی در سبد خرید شما وجود ندارد.
Unleash the Power of Data Visualization with Tableau for Comprehensive Insights and Dynamic Reporting.
در این روش نیاز به افزودن محصول به سبد خرید و تکمیل اطلاعات نیست و شما پس از وارد کردن ایمیل خود و طی کردن مراحل پرداخت لینک های دریافت محصولات را در ایمیل خود دریافت خواهید کرد.

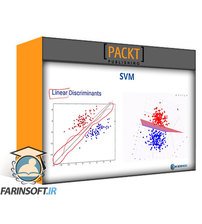
یادگیری ماشین A-Z: پشتیبانی از دستگاه بردار با پایتون
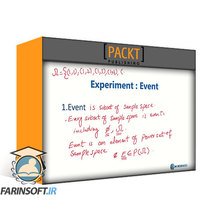
کورس یادگیری احتمالات و آمار در زبان Python

Python Mastery for Data, Statistics & Statistical Modeling

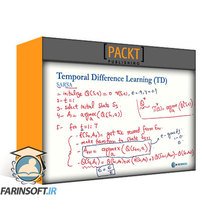
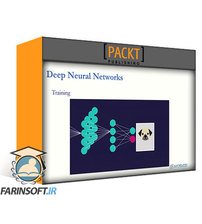
Deep Learning: Python Deep Learning Masterclass
کورس کدنویسی یادگیری ماشینی بوسیله زبان Python

NLP-Natural Language Processing in Python(Theory & Projects)
MongoDB برای مبتدیان (نظریه و پروژه ها)
پردازش زبان طبیعی NLP در پایتون برای مبتدیان
آموزش کار با داده ها و مصور سازی آن ها در زبان Python

Mastering Github: A Comprehensive Guide

✨ تا ۷۰% تخفیف با شارژ کیف پول 🎁
مشاهده پلن ها