وب سایت تخصصی شرکت فرین
دسته بندی دوره ها

Visualizing Advanced Charts and Graphs

سرفصل های دوره

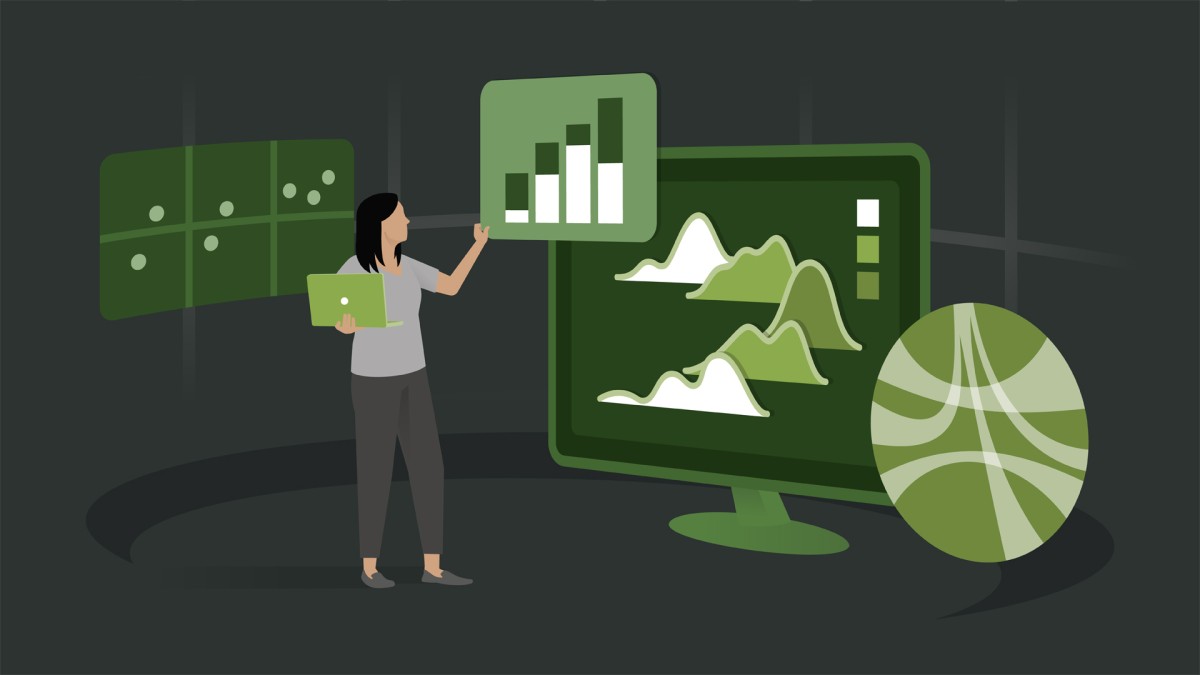
Visualizing data sets as charts and graphs can do wonders to communicate complex business needs, depict underlying patterns, and make data trends crystal clear. But you need to develop your understanding of the many types of visualization elements that exist—and when and how to use which to be most effective. In this course, join designer and infographics expert Amy Balliett as she takes a deep dive into next-level data visualization strategies with advanced charts and graphs.

Learn how our brains respond to data visualization to inform your selection strategy. Amy covers various types of charts and graphs, offering advice and tips for how to render them effectively to represent distribution, comparison, relationships, and composition. Discover how to use visualizations such as plots, Sankey diagrams, alluvial charts, parallel sets, bullet graphs, radial charts, Coxcomb charts, coordinate plots, chord diagrams, maps, Marimekko charts, streamgraphs, and more.


01 - Introduction
  • 01 - Moving beyond basic data viz
  • 02 - Do you need the basics first

  • 02 - 1. Using Advanced Charts and Graphs
  • 01 - What makes a chart or graph advanced
  • 02 - How the brain responds to data viz
  • 03 - The chart selection framework

  • 03 - 2. Advanced Distribution Charts and Graphs
  • 01 - What are distribution charts and graphs
  • 02 - Density plots explained What, when, why, and how
  • 03 - Ridgeline (joy) plots explained What, when, why and how
  • 04 - Box plots explained What, when, why, and how
  • 05 - Variations of box plots Violin plots and more
  • 06 - Sankey diagrams explained What, when, why and how

  • 04 - 3. Advanced Comparison Charts and Graphs
  • 01 - What are comparison charts and graphs
  • 02 - Alluvial charts and parallel sets What, when, why, and how
  • 03 - Bullet graphs explained What, when, why, and how
  • 04 - Radial charts explained What, when, why, and how
  • 05 - Radar charts explained What, when, why and how
  • 06 - Coxcomb charts What, when, why and how

  • 05 - 4. Advanced Relationship Charts and Graphs
  • 01 - What are relationship charts and graphs
  • 02 - Parallel coordinates plots What, when, why, and how
  • 03 - Chord diagrams explained What, when, why, and how
  • 04 - Using maps for advanced data visualizations

  • 06 - 5. Advanced Composition Charts and Graphs
  • 01 - What are composition charts and graphs
  • 02 - Marimekko charts explained What, when, why, and how
  • 03 - Sunburst diagrams explained What, when, why, and how
  • 04 - Streamgraphs explained What, when, why, and how

  • 07 - Conclusion
  • 01 - Continuing to hone your advanced data visualization skills
  • 139,000 تومان
    بیش از یک محصول به صورت دانلودی میخواهید؟ محصول را به سبد خرید اضافه کنید.
    خرید دانلودی فوری

    در این روش نیاز به افزودن محصول به سبد خرید و تکمیل اطلاعات نیست و شما پس از وارد کردن ایمیل خود و طی کردن مراحل پرداخت لینک های دریافت محصولات را در ایمیل خود دریافت خواهید کرد.

    ایمیل شما:
    تولید کننده:
    مدرس:
    شناسه: 26740
    حجم: 390 مگابایت
    مدت زمان: 133 دقیقه
    تاریخ انتشار: 26 آذر 1402
    طراحی سایت و خدمات سئو

    139,000 تومان
    افزودن به سبد خرید