وب سایت تخصصی شرکت فرین
دسته بندی دوره ها
2

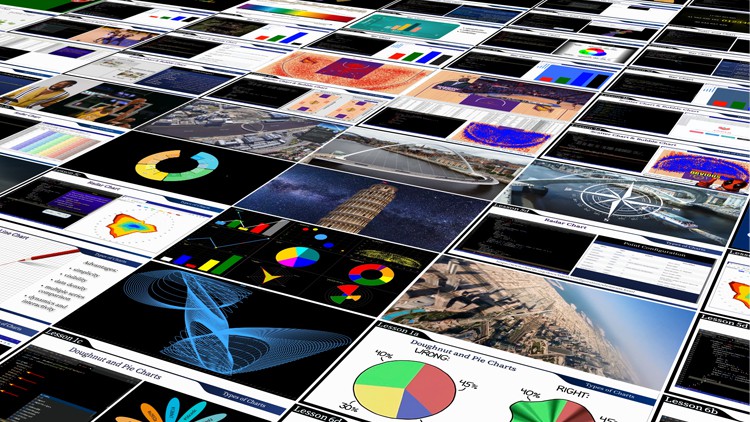
Chart js 4 Creating Perfect Charts [ Tips and tricks ]

سرفصل های دوره

Chart.js Learn how to build dynamic and interactive graphs, charts, and diagram using Chart js v.4 [ Theory & Practice ]


1. Basic Concepts
  • 1.1 Chapter 1 Lesson 1.zip
  • 1. Preparation [Setting Up Your Environment]
  • 2. 3 Steps to create a chart with chart.js library
  • 3. The basic scenario of creating a chart
  • 4. Inspecting a chart object
  • 5. The arsenal of the chart js library in terms of chart variety
  • 6. The additional configuration sections

  • 2. Doughnut and Pie Charts [The interactive chart Visualizing the Seasons]
  • 1. Introduction. Historical background.
  • 2.1 Chapter 2 Lesson 1.zip
  • 2. Html structure, css styles, the simplest kind of graphics in JavaScript
  • 3. Additional properties, datasets
  • 4. Fine-tuning [options, plugins, hover effects]

  • 3. PolarArea chart. Dynamics. [Unlocking the Secrets of Pi
  • 1.1 Chapter 3 Lesson 1.zip
  • 1. General information. Problem statement. Structure of html
  • 2. Preparing a template to display the graph.
  • 3. Parsing and preparation of data for dynamical charting
  • 4. Development of a mechanism for updating the dynamic chart
  • 5. Acceleration. The Secret of Pi. Conclusions.

  • 4. Bar Chart [Interactive work with colors]
  • 1.1 Chapter 4 Lesson 1.zip
  • 1. Introduction. HTML & CSS setup
  • 2. Customize the initial appearance and of the chart.
  • 3. Linking sliders to the chart. Update.
  • 4. Fine-tuning the chart

  • 5. Bubble Chart & Scatter Chart [Statistical chart of shots in basketball]
  • 1.1 Chapter 5 Lesson 1.zip
  • 1. Introduction. HTML structure.
  • 2. Events. Overview of the structure. Canvas setup.
  • 3. Building the method of reading and parsing the source data. Source chart.
  • 4. Precise positioning of the background. Adjustment of axes. Data selection.
  • 5. Use of hyperlinks. Statistics for experiments. Conclusion.

  • 6. Radar Chart [Wind Rose]
  • 1.1 Chapter 6 Lesson 1.zip
  • 1. Introduction, general information. Project composition, Html setup.
  • 2. Analyzing the structure of the original data. Collection and processing.
  • 3. Build the initial view of the chart and initial setup.
  • 4. Fine-tune the appearance of the chart.
  • 5. A few finishing touches. Assignments for independent work.

  • 7. Line Chart [Exploring Dynamic Graphs of Functions]
  • 1.1 Chapter 7 Lesson 1.zip
  • 1. Introduction. HTML structure.
  • 2. The overall structure of the module. Events. Initial view of the chart.
  • 3. Work on dynamics and animation. Control methods.
  • 4. Methods of customizing the chart view. Alternative animation option.
  • 5. Drawing on top of the chart using custom plugins.
  • 139,000 تومان
    بیش از یک محصول به صورت دانلودی میخواهید؟ محصول را به سبد خرید اضافه کنید.
    افزودن به سبد خرید
    خرید دانلودی فوری

    در این روش نیاز به افزودن محصول به سبد خرید و تکمیل اطلاعات نیست و شما پس از وارد کردن ایمیل خود و طی کردن مراحل پرداخت لینک های دریافت محصولات را در ایمیل خود دریافت خواهید کرد.

    ایمیل شما:
    تولید کننده:
    مدرس:
    شناسه: 23870
    حجم: 1344 مگابایت
    مدت زمان: 151 دقیقه
    تاریخ انتشار: ۱۲ آذر ۱۴۰۲
    دیگر آموزش های این مدرس
    طراحی سایت و خدمات سئو

    139,000 تومان
    افزودن به سبد خرید