وب سایت تخصصی شرکت فرین
دسته بندی دوره ها
6

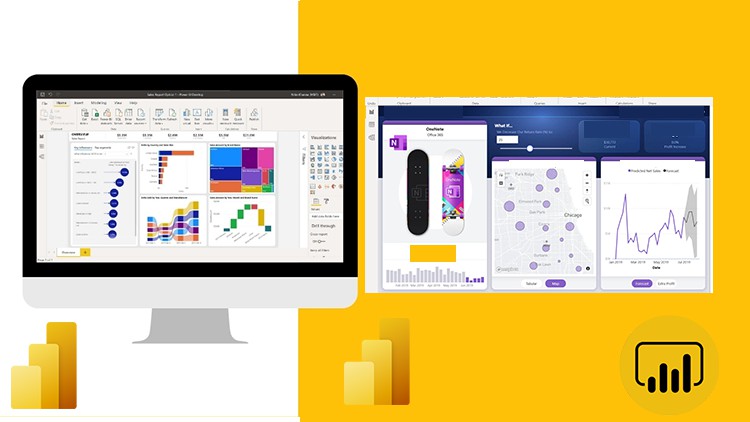
Microsoft Power BI Desktop and DAX plus Dashboard creation

سرفصل های دوره

2023 Edition Power BI Desktop Course. Learn DAX with projects and how to create Reports and Dashboards


1 - Course Projects
  • 1 - Take a look at the projects we are going to create in this Course

  • 2 - Intro to POPWER BI Desktop
  • 2 - Best place to Install Power BI Desktop from
  • 3 - Important Power BI Settings you need to Know
  • 4 - Quick tour to Power BI
  • 5 - All helpful resources to Learn Power BI

  • 3 - How to Connect and Transform Data in Power Query
  • 6 - AdventureWorksCSV.zip
  • 6 - All-Resources.zip
  • 6 - Backgrounds.zip
  • 6 - Editable-Backgrounds.zip
  • 6 - Importing Product Table to Power Query
  • 6 - Power-Query-Date-Code.txt
  • 6 - completed-dashboard.zip
  • 7 - Understanding the Query Editor
  • 8 - Choose columns and Removing columns
  • 9 - Power Query Marge Column and Column from Example
  • 10 - Extracting Text in Power Qury
  • 11 - Regional data Settings
  • 12 - Intro to Append Queries
  • 13 - Basic way to Append Queries or Tables
  • 14 - Advanced way to Append Queries or Tables
  • 15 - Adding Index Number and Merging Queries
  • 16 - How to Merge multiple columns
  • 17 - Importing the Returns FactTable
  • 18 - Power Query Static Calendar Table
  • 19 - Build Dynamic Power Query Calendar Table
  • 20 - Exclude some Tables from Report Refresh
  • 21 - How to solve some common Queries Error
  • 4 - Creating Data Modeling
  • 22 - Intro to Data Model
  • 23 - Arranging Tables in the Models
  • 24 - Creating a Star Schema Relationships
  • 25 - Creating SnowFlake Relationships

  • 5 - 04 How to create a Date Table using DAX
  • 26 - How to create A Date Table with DAX
  • 27 - How to restrict CALENDAR AUTO with VAR
  • 28 - Two ways to add columns in a Data Table
  • 29 - How to use IN and If Function
  • 30 - Mark your date table

  • 6 - Understand Calculated Column in Power BI
  • 31 - Intro to DAX Language in Power BI
  • 32 - Understanding Implicit Measures and Explicit Measures
  • 33 - Intro to Calculated Column
  • 34 - Aggregation with Calculated column
  • 35 - Fixing Percentage Error in Calculated column
  • 36 - Calculate Order Level in Calculated column
  • 37 - Customer Segmentation in Calculated Column

  • 7 - Understand DAX Measures
  • 38 - Intro to DAX Measures
  • 39 - How to Organize your Measures in a Single Table
  • 40 - DAX Measures for Aggregations
  • 41 - Calculating Returned and Refund Rates
  • 42 - Correct way to use the Count Functions 1
  • 43 - Correct way to use the Count Functions 2
  • 44 - Intro to the Calculate Function
  • 45 - Details on Calculated Columns
  • 46 - Transaction in Canada using CACULATE FUNCTION
  • 47 - Best Website to learn DAX FUNCTIONS
  • 48 - All and Calculate Function
  • 49 - Us All Function with multiple Tables
  • 50 - Allselected with Calculate to get correct Percentage
  • 51 - Adding Comment in Power BI
  • 52 - Understand DAX Table Function
  • 53 - The AND Function
  • 54 - Advanced AND Function

  • 8 - Understand Context Transition
  • 55 - Intro to Context Transition
  • 56 - Changing Row context to Filter Context
  • 57 - Segmenting Customer using Context Transition
  • 58 - Adding DrillThrough To know your customers by segment

  • 9 - Simplify DAX with Variables
  • 59 - Simplify DAX with Variables
  • 60 - 02 Example of VAR or variables
  • 61 - 03 VAR with Percentage of Grand Total
  • 62 - Fix Issues on Customer Table
  • 63 - Creating a disconnected Table for Top N
  • 64 - Top N measure
  • 65 - 08 Top N with WhatIf Parameter

  • 10 - 09 Understand the default Filters in Power BI Desktop
  • 66 - Understand Filter on This Visual
  • 67 - Understand Filter on This Page alone
  • 68 - Filter on All pages

  • 11 - Visualization Learn to create a Detailed Dashboard
  • 69 - Dashboard Overview
  • 70 - How to Sketch your Dashboard Layout before Creation
  • 71 - Creating a KPI Cards
  • 72 - Finding Profitable customer and Product
  • 73 - Show daily Trend with a Line Chart and zooming option
  • 74 - Top 10 Ordered Products
  • 75 - Things you need to create clean Dashboard
  • 76 - Formatting Dashboard
  • 77 - Arranging Shapes in Power Point for dashboard Template
  • 78 - How to pick correlated colors for your Dashboard
  • 79 - Getting statics and Animated Icons
  • 80 - Formatting and adding Animated Icons to our Dashboard
  • 81 - Formatting Table
  • 82 - Edit Interactions for slicers and visuals
  • 83 - Adding Bookmarks buttons and blur plus Map chart
  • 84 - How to show and Hide Bookmarks
  • 85 - Adjust shape in Power point

  • 12 - Visualization Dashboard with profit forecast
  • 86 - Project Dataset.html
  • 87 - Challenge Dashboard
  • 88 - Creating Forecast in a Line Chart
  • 89 - Using the Gauge Chart for comparing values with Target
  • 90 - Creating Tooltip Template in Power Point
  • 91 - Creating a custom Tooltip
  • 92 - Creating Conditional Formatting Measure for a Gauge Chart
  • 93 - How to fix Blank Error
  • 94 - Weekday Profit
  • 95 - Adding Slicers
  • 96 - Adding Drill Through
  • 97 - How to add Info to Drill Through
  • 98 - Formatting dashboard and adding background

  • 13 - Dashboard using WhatIf Parameter to change Scenarios
  • 99 - Project Dataset.html
  • 100 - Intro to WhatIf Analysis Dashboard
  • 101 - Parameter slide for Quantity Ordered
  • 102 - Parameter for Cost Change
  • 103 - Parameter for changing prices of products
  • 104 - Profit percentage change
  • 105 - Creating Table and formatting
  • 106 - Creating Dark template in Power point formatting
  • 107 - How to create a conditional Measures to show Up and Down trends

  • 14 - WhatIf Analysis Dashboard with Top5
  • 108 - Project Dataset.html
  • 109 - Dashboard intro
  • 110 - Creating new page
  • 111 - Charts for Top New and Old Products
  • 112 - KPI Cards
  • 113 - Creating Template in Power Point
  • 114 - Changing Dashboard colors

  • 15 - Sales Returns Dashboard
  • 115 - Project Dataset.html
  • 116 - Intro to Returned Dashboard
  • 117 - Important KPIs
  • 118 - Returned and Refund Trend
  • 119 - Align charts and cards
  • 120 - Creating a template in Power Point
  • 121 - Importing and Formatting dashboard
  • 122 - How to create hide and show filter part 1
  • 123 - How to create hide and show filter part 2
  • 124 - Changing cards in Power Point
  • 125 - How to Create Advanced caption using DAXVAR
  • 139,000 تومان
    بیش از یک محصول به صورت دانلودی میخواهید؟ محصول را به سبد خرید اضافه کنید.
    خرید دانلودی فوری

    در این روش نیاز به افزودن محصول به سبد خرید و تکمیل اطلاعات نیست و شما پس از وارد کردن ایمیل خود و طی کردن مراحل پرداخت لینک های دریافت محصولات را در ایمیل خود دریافت خواهید کرد.

    ایمیل شما:
    تولید کننده:
    شناسه: 15979
    حجم: 15300 مگابایت
    مدت زمان: 1193 دقیقه
    تاریخ انتشار: ۱۵ تیر ۱۴۰۲
    طراحی سایت و خدمات سئو

    139,000 تومان
    افزودن به سبد خرید