در حال حاضر محصولی در سبد خرید شما وجود ندارد.
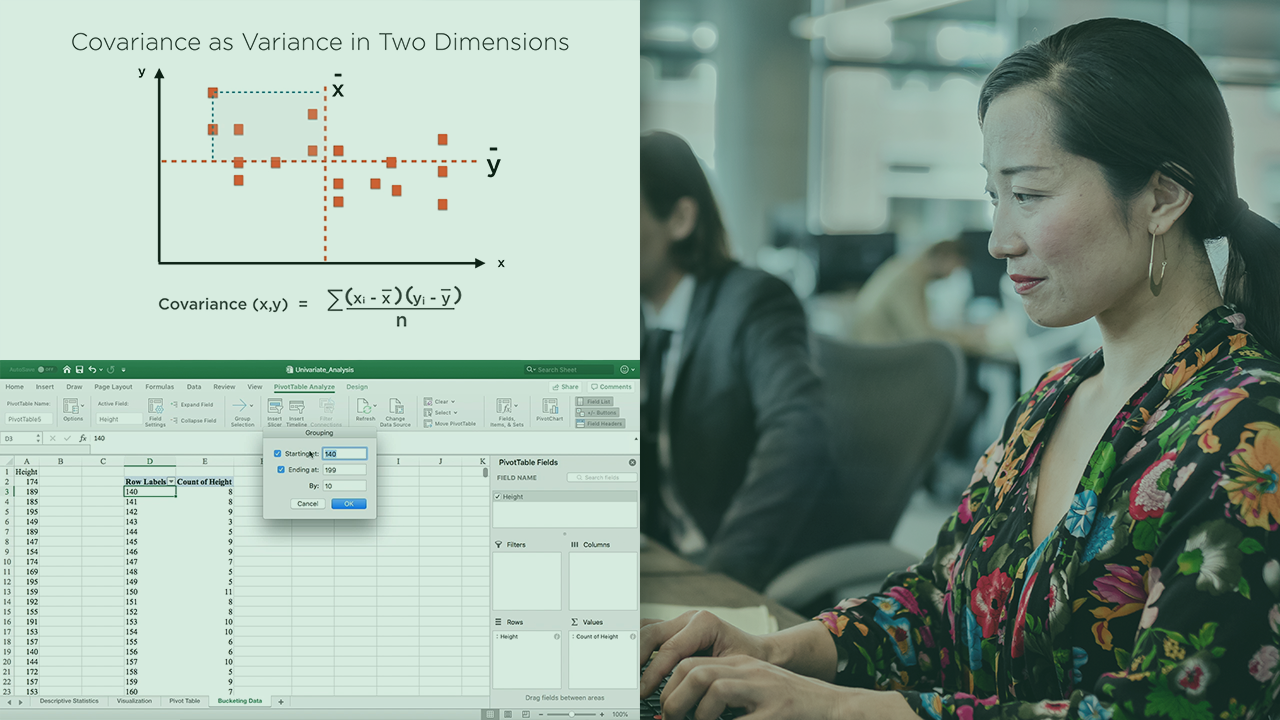
This course covers the most important aspects of exploratory data analysis using different univariate, bivariate, and multivariate statistics from Excel and Python, including the use of Naive Bayes' classifiers and Seaborn to visualize relationships.
در این روش نیاز به افزودن محصول به سبد خرید و تکمیل اطلاعات نیست و شما پس از وارد کردن ایمیل خود و طی کردن مراحل پرداخت لینک های دریافت محصولات را در ایمیل خود دریافت خواهید کرد.


Building Your First scikit-learn Solution

Combining and Shaping Data
آموزش کاهش ابعاد داده ها با استفاده از Scikit-learn
مفاهیم کلیدی یادگیری ماشینی

Learning Apache Airflow
آموزش پیاده سازی متدهای Bootstrap در زبان R

Applying the Mathematical MASS Model with R

Performing Dimension Analysis with R
فیلم یادگیری کامل Evaluating a Data Mining Model

Streamlining API Management Using Google Apigee

فوری … نیمی از محصولات حذف شد! حذف کامل سایت تا اواسط تیر توضیحات