در حال حاضر محصولی در سبد خرید شما وجود ندارد.
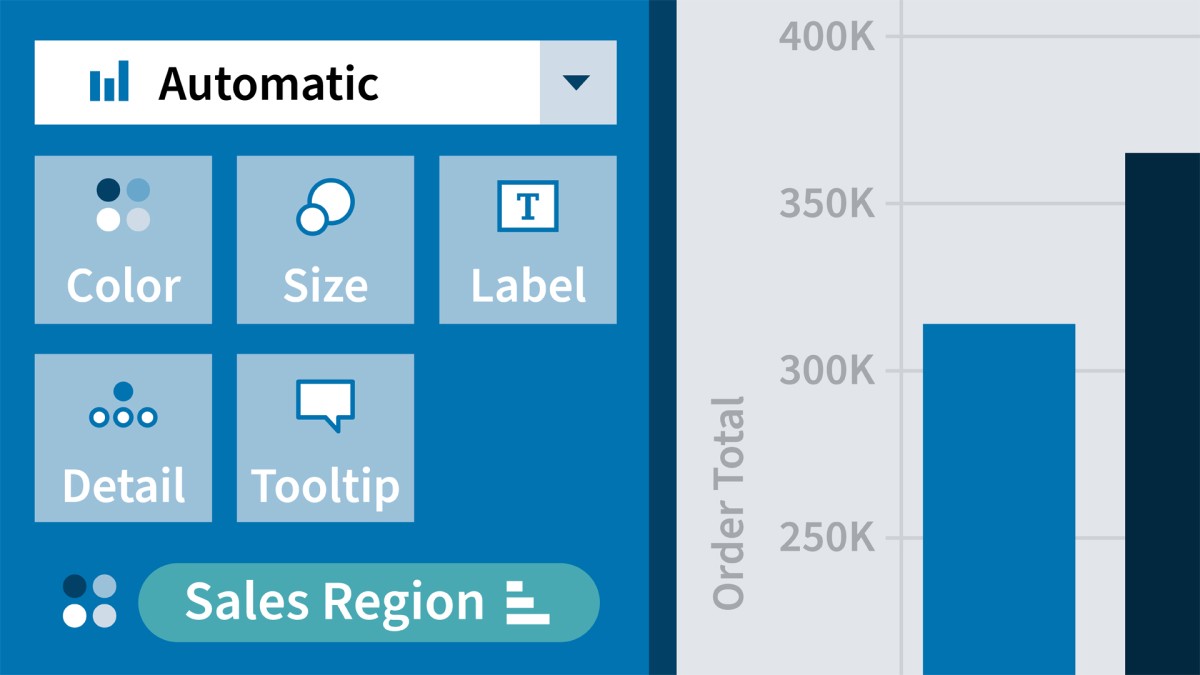
Tableau is a powerful and versatile data analytics and visualization tool that many consider indispensable for data science work. Its drag-and-drop interface makes it easy to sort, compare, and analyze data from multiple sources, including Excel, SQL Server, and cloud-based data repositories. In this course, learn how to analyze and display data using Tableau 2023—and make better, more data-driven decisions for your company. Instructor Curt Frye shows how to install Tableau, connect to data sources, and sort and filter your data. Curt uses real-world examples to demonstrate how to create and manipulate data visualizations—including highlight tables, charts, scatter plots, histograms, maps, and dashboards—and shows how to share your visualizations.
در این روش نیاز به افزودن محصول به سبد خرید و تکمیل اطلاعات نیست و شما پس از وارد کردن ایمیل خود و طی کردن مراحل پرداخت لینک های دریافت محصولات را در ایمیل خود دریافت خواهید کرد.


آموزش تحلیل کلاسترها در Excel
-main-resized.jpg)
دوره یادگیری اکسل آفیس 365 ویژه Mac OS X

فیلم یادگیری Crystal Reports 2013
یادگیری تحلیل بوسیله What-If در نرم افزار Excel

فیلم یادگیری QlikView

آموزش مدیریت فایل ها و داده ها در اکسل بوسیله Excel VBA

Tableau 10 Essential Training
آموزش پیشرفته PivotTables ها در اکسل

دوره استفاده از اسکریپت های VBA در نرم افزار Access

فیلم یادگیری VBA در نرم افزار Excel

✨ تا ۷۰% تخفیف با شارژ کیف پول 🎁
مشاهده پلن ها