وب سایت تخصصی شرکت فرین
دسته بندی دوره ها
8

Tableau 2024.1: Essential Training

سرفصل های دوره

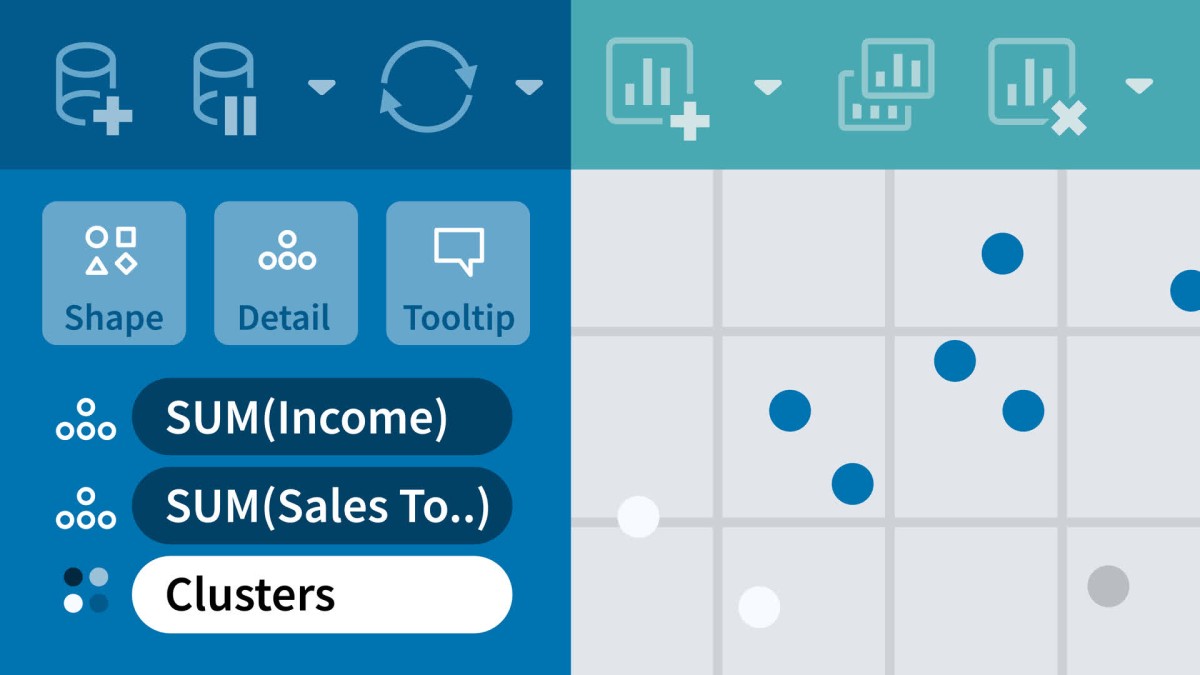
Tableau is a powerful and versatile data analytics and visualization tool that many consider indispensable for data science work. Its drag-and-drop interface makes it easy to sort, compare, and analyze data from multiple sources, including Excel, SQL Server, and cloud-based data repositories. In this course, learn how to analyze and display data using Tableau 2024—and make better, more data-driven decisions for your company. Instructor Curt Frye uses real-world examples to demonstrate how to create, manipulate, and share data visualizations.


01 - Introduction
  • 01 - Apply the power of Tableau 2024 to your data
  • 02 - What you should know before starting

  • 02 - 1. Introducing Tableau
  • 01 - Download Tableau
  • 02 - Install Tableau drivers
  • 03 - Introducing Tableau file types
  • 04 - Get help in Tableau

  • 03 - 2. Managing Data Sources and Visualizations
  • 01 - Connect to a data source
  • 02 - Join related data sources
  • 03 - Join data sources with inconsistent field names
  • 04 - Clean up source data
  • 05 - Reorder fields in a visualization
  • 06 - Change the summary operation
  • 07 - Split text into multiple columns

  • 04 - 3. Managing Tableau Worksheets and Workbooks
  • 01 - Display the data underlying a workbook
  • 02 - Add, duplicate, and rename worksheets
  • 03 - Reorder, clear, and delete worksheets
  • 04 - Change a worksheets tab color
  • 05 - Show or hide worksheet elements
  • 06 - Save your changes
  • 07 - Save your workbook as a PDF file
  • 08 - Create a packaged workbook
  • 09 - Export data to a CSV file

  • 05 - 4. Creating Custom Calculations and Fields
  • 01 - Present Tableau operators and built-in functions
  • 02 - Create a calculated field
  • 03 - Create a calculated field on a shelf
  • 04 - Add a table calculation
  • 05 - Use level of detail expressions

  • 06 - 5. Analyzing Data
  • 01 - Calculate averages, medians, minimums, and maximums
  • 02 - Count occurrences and distinct items
  • 03 - Display the Summary Card
  • 04 - Calculate percentages within a table
  • 05 - Forecast future values

  • 07 - 6. Sorting and Filtering Tableau Data
  • 01 - Sort based on a fields values
  • 02 - Create a nested sort
  • 03 - Create a selection filter
  • 04 - Create a wildcard filter
  • 05 - Create a condition filter
  • 06 - Create a top filter
  • 07 - Edit, clear, and delete filters
  • 08 - Filter data using parameters
  • 09 - Edit and delete parameters

  • 08 - 7. Defining Groups and Sets
  • 01 - Define a group
  • 02 - Define a group for other values
  • 03 - Find members of a group
  • 04 - Edit and delete groups
  • 05 - Define a set
  • 06 - Create summaries using sets
  • 07 - Combine sets
  • 08 - Edit and delete sets

  • 09 - 8. Creating Basic Visualizations
  • 01 - Create column and stacked column charts
  • 02 - Create line charts and area fill charts
  • 03 - Create pie charts
  • 04 - Create scatter plots
  • 05 - Identify data clusters
  • 06 - Create histograms
  • 07 - Summarize data using a smart histogram
  • 08 - Create a treemap

  • 10 - 9. Formatting Tableau Visualizations
  • 01 - Change the visual summary type
  • 02 - Change the appearance of your data
  • 03 - Set a default format for a field
  • 04 - Display a visualization in Presentation mode
  • 05 - Create a highlight table
  • 06 - Display a viz in a tooltip

  • 11 - 10. Annotating and Formatting Visualizations
  • 01 - Annotate a visualization
  • 02 - Format chart elements
  • 03 - Change the order of colors in a visualization
  • 04 - Add a trend line to a chart
  • 05 - Add reference lines and quartile indicators

  • 12 - 11. Mapping Geographic Data
  • 01 - Create a basic map
  • 02 - Add and remove map layers
  • 03 - Enhance map analysis using distance measurement tools
  • 04 - Disable pan and zoom in maps
  • 05 - Define custom regions

  • 13 - 12. Creating Dashboards and Actions
  • 01 - Present data using Storylines
  • 02 - Create a dashboard
  • 03 - Arrange and resize dashboard elements
  • 04 - Replace a worksheet in a dashboard quickly
  • 05 - Define a filter action
  • 06 - Define a highlight action
  • 07 - Define parameter actions

  • 14 - Conclusion
  • 01 - Further resources
  • 139,000 تومان
    بیش از یک محصول به صورت دانلودی میخواهید؟ محصول را به سبد خرید اضافه کنید.
    افزودن به سبد خرید
    خرید دانلودی فوری

    در این روش نیاز به افزودن محصول به سبد خرید و تکمیل اطلاعات نیست و شما پس از وارد کردن ایمیل خود و طی کردن مراحل پرداخت لینک های دریافت محصولات را در ایمیل خود دریافت خواهید کرد.

    ایمیل شما:
    تولید کننده:
    مدرس:
    شناسه: 42186
    حجم: 613 مگابایت
    مدت زمان: 282 دقیقه
    تاریخ انتشار: ۷ دی ۱۴۰۳
    دسته بندی محصول
    طراحی سایت و خدمات سئو

    139,000 تومان
    افزودن به سبد خرید