در حال حاضر محصولی در سبد خرید شما وجود ندارد.

Tableau is the widely used data analytics and visualization tool that many consider indispensable for data-science-related work. Its drag-and-drop interface makes it easy to sort, compare, and analyze data from multiple sources, including Excel, SQL Server, and cloud-based data repositories. Tableau 10: Essential Training explains everything you need to know to analyze and display data using Tableau Desktop—and make better, more data-driven decisions for your company. After completing the course, you'll be able to install Tableau, connect to data sources, summarize data, and create, manipulate, and share data visualizations, including highlight tables, charts, scatter plots, histograms, maps, dashboards, and more.
در این روش نیاز به افزودن محصول به سبد خرید و تکمیل اطلاعات نیست و شما پس از وارد کردن ایمیل خود و طی کردن مراحل پرداخت لینک های دریافت محصولات را در ایمیل خود دریافت خواهید کرد.


MATLAB Essential Training

آموزش مدیریت فایل ها و داده ها در اکسل بوسیله Excel VBA
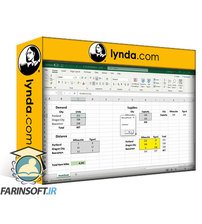
آموزش شبیه سازی مدیریت و تحلیل زنجیره تامین با VBA در Excel
آموزش پیشرفته PivotTables ها در اکسل
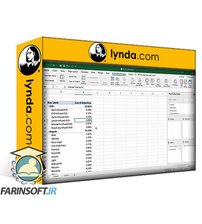
آموزش کامل PivotTables در نرم افزار اکسل ویژه Mac

آموزش کامل Crystal Reports 2016

فیلم یادگیری Crystal Reports 2013

MATLAB Essential Training
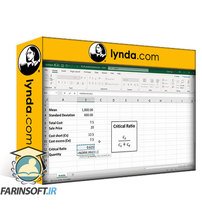
تجزیه و تحلیل زنجیره تامین در Excel : حل مشکلات موجودی
-main-resized.jpg)
کار با PivotTables ها در نرم افزار Excel

✨ تا ۷۰% تخفیف با شارژ کیف پول 🎁
مشاهده پلن ها