در حال حاضر محصولی در سبد خرید شما وجود ندارد.

Get an introduction to Reporting Services, one of the core add-on components to SQL Server. With Reporting Services, you can create report frameworks that incorporate data tables, charts, maps, and other visualizations to help make sense of the data stored in a database. Instructor Adam Wilbert shows you how to configure all of the components and add them to traditional paginated reports, and how to organize those reports on a centralized web portal.
در این روش نیاز به افزودن محصول به سبد خرید و تکمیل اطلاعات نیست و شما پس از وارد کردن ایمیل خود و طی کردن مراحل پرداخت لینک های دریافت محصولات را در ایمیل خود دریافت خواهید کرد.


آموزش توسعه برنامه های Database

مدیریت پایگاه داده های ارتباطی در مایکروسافت Azure
فیلم یادگیری مایکروسافت SQL Server 2016
-Cert-Prep-1-The-Azure-Data-Platform-main-resized.jpg)
مدیریت پایگاه داده های ارتباطی در مایکروسافت Azure (DP-300) CERT PREP: 1 پلت فرم داده Azure
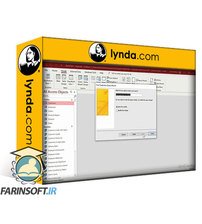
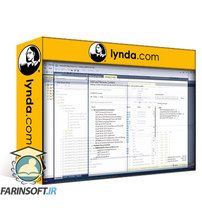
کار با نرم افزار Access 2021 : کار با بازجست ها ( Query )

SQL Server: Reporting Services
آموزش کامل امکانات و قابلیت های جدید SQL Server 2017
آموزش مباحث ساختمان داده در دیتابیس ها

آموزش کار با امکانات و ابزارهای جدید SQL Server 2019
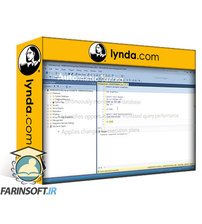
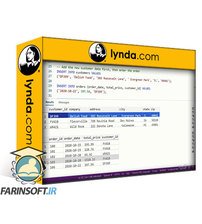
آموزش کار با Trigger ها در دیتابیس های SQL Server
