در حال حاضر محصولی در سبد خرید شما وجود ندارد.

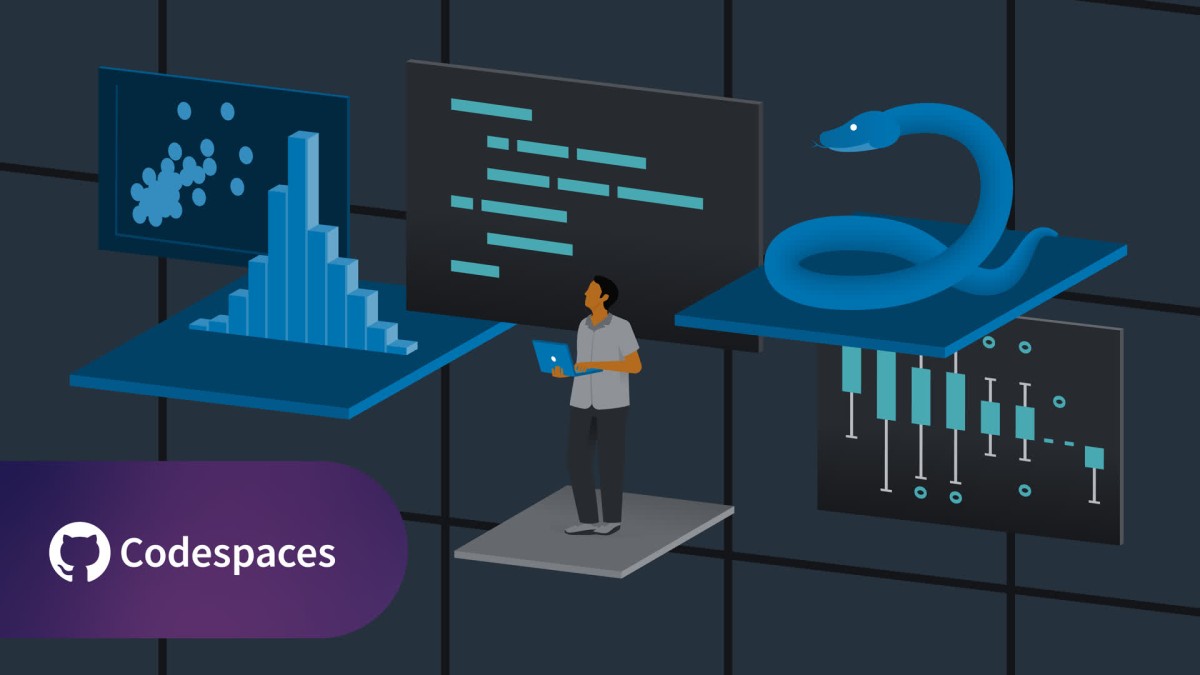
The field of statistics has become increasingly dependent on data analysis and interpretation using Python. With the rise of big data and data science, the demand for professionals who can effectively analyze and interpret data using Python has skyrocketed. In this course, Matt Harrison teaches you how to collect, clean, analyze, and visualize data using the powerful tools of the Python programming language. Join Matt as he gives into the various techniques that form the backbone of statistics and helps you understand the data with summary statistics and visualizations. He explains how to create predictive models using both linear regression andXGBoost, and wraps up the course with a look at hypothesis testing. If you’re interested in exploring statistics using a code-first approach, join Matt in this course as he shows you how to use Python to unlock the power of data.
در این روش نیاز به افزودن محصول به سبد خرید و تکمیل اطلاعات نیست و شما پس از وارد کردن ایمیل خود و طی کردن مراحل پرداخت لینک های دریافت محصولات را در ایمیل خود دریافت خواهید کرد.


آموزش کدنویسی اعداد ، تبدیل اعداد و عملگرهای عددی در Python

Getting Started with Python for Finance

Core Python 3: The Numeric Tower, Conversion, and Operators

Applied Machine Learning: Algorithms

Core Python 3: The Numeric Tower, Conversion, and Operators

Core Python 3: The Numeric Tower, Conversion, and Operators

Applied Machine Learning: Feature Engineering

آموزش خوشه بندی یا Classification بوسیله XGBoost
✨ تا ۷۰% تخفیف با شارژ کیف پول 🎁
مشاهده پلن ها