وب سایت تخصصی شرکت فرین
دسته بندی دوره ها

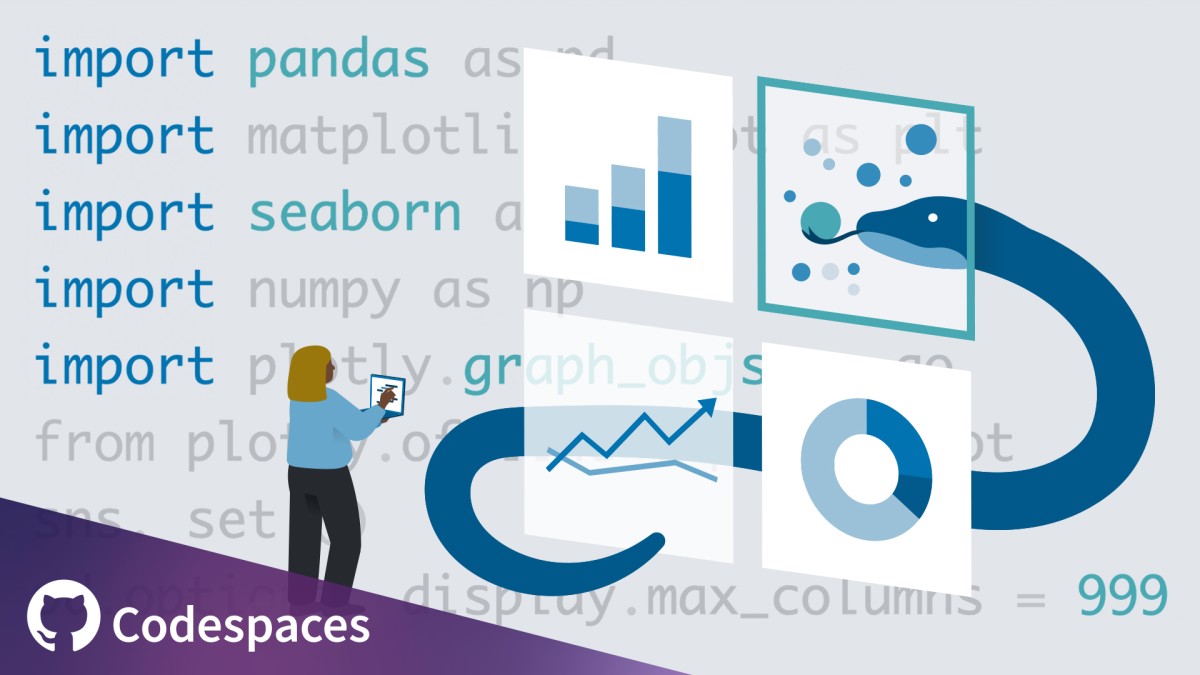
Practical Python for Data Professionals

سرفصل های دوره

As data and data-related jobs have grown over the past decade, so has the demand for data skills. If you’re a data professional, this is great news! However, it’s important to continue to adapt to the changing demands of the market, which include adopting tools like Python to approach big data challenges. In this course, Sarah Nooravi shares a practical, project-based examination of Python, covering the skills needed to help you stand out among others in a competitive market. Sarah walks through an end-to-end Python analysis, typical of what you would encounter on the job– starting from the problem statement and takes you all the way through to insight delivery. Sarah helps you break down the problem, set expectations, and covers best practices around data cleaning, data visualization and storytelling. Lastly, she also shares common pitfalls and critical business and soft skills that will help you stand out.


01 - Introduction
  • 01 - Introduction
  • 02 - Prerequisites

  • 02 - 1. Case Study Introduction
  • 01 - The who, what, where, and why
  • 02 - Who
  • 03 - What
  • 04 - Where
  • 05 - Why
  • 06 - Case study introduction

  • 03 - 2. Breaking Down the Problem Statement
  • 01 - Define the problem The three Ds
  • 02 - Get familiar Domain
  • 03 - Domain Applied
  • 04 - Get familiar Data
  • 05 - Get familiar Deliverable
  • 06 - Set the right expectations

  • 04 - 3. Data Collection, Cleaning, and Transformation
  • 01 - Getting set up in Codespaces
  • 02 - Read in data from a CSV file
  • 03 - General cleaning techniques
  • 04 - General cleaning techniques High-level checks
  • 05 - General cleaning techniques Missing values
  • 06 - Data transformations Binning

  • 05 - 4. EDA
  • 01 - Introduction to EDA
  • 02 - Summary statistics
  • 03 - Distributions Histograms
  • 04 - Data transformations Normalization and log
  • 05 - Other distribution types
  • 06 - Data visualizations Comparing categories
  • 07 - Data visualization Data tables
  • 08 - Data visualization Relationships
  • 09 - Create a ridge plot

  • 06 - 5. Data Visualization and Storytelling
  • 01 - Visual best practices Part 1
  • 02 - Visual best practices Part 2
  • 03 - Leverage exploratory and explanatory visualizations
  • 04 - Choose a medium
  • 05 - Storyboarding
  • 06 - Whats in a story
  • 07 - Putting it all together

  • 07 - Conclusion
  • 01 - Wrap-up and next steps
  • 139,000 تومان
    بیش از یک محصول به صورت دانلودی میخواهید؟ محصول را به سبد خرید اضافه کنید.
    خرید دانلودی فوری

    در این روش نیاز به افزودن محصول به سبد خرید و تکمیل اطلاعات نیست و شما پس از وارد کردن ایمیل خود و طی کردن مراحل پرداخت لینک های دریافت محصولات را در ایمیل خود دریافت خواهید کرد.

    ایمیل شما:
    تولید کننده:
    مدرس:
    شناسه: 11680
    حجم: 365 مگابایت
    مدت زمان: 117 دقیقه
    تاریخ انتشار: ۲۱ اردیبهشت ۱۴۰۲
    دیگر آموزش های این مدرس
    طراحی سایت و خدمات سئو

    139,000 تومان
    افزودن به سبد خرید