وب سایت تخصصی شرکت فرین
دسته بندی دوره ها

Microsoft Excel- Create Dashboards and Master Power Query

سرفصل های دوره

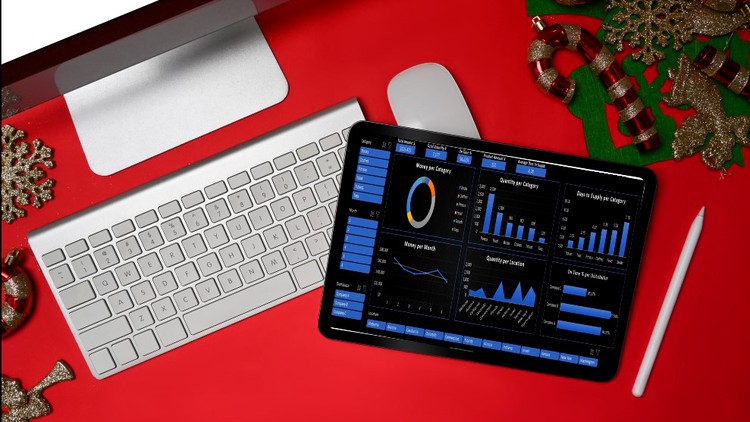
Master Excel's most useful formulas and create your own dashboard using Power Query - from scratch!


1. Introduction
  • 1. Preview and Advertisment
  • 2. Setting Expectations
  • 3. Introducing the tables
  • 4. Excel + Computers Basics

  • 2. Excel Functions
  • 1.1 Customers.xlsx
  • 1. Customers file
  • 2. Date and Time
  • 3. Text to Columns
  • 4. Table Relationships
  • 5. Table Design and Name
  • 6. Month and Weeknum columns
  • 7. Vlookup
  • 8. Match
  • 9. Countif and Countifs
  • 10. Sumif and Sumifs
  • 11. Conditional Formatting
  • 12. Remove Duplicates
  • 13. Filter Function and Q1
  • 14. SortBy Function and Q2

  • 3. Power Query
  • 1.1 Orders.csv
  • 1.2 Prices.csv
  • 1. Get Data, Append, Merge
  • 2. Power Query Editor - Basic
  • 3. Power Query Editor - Home
  • 4. Power Query Editor - Transform
  • 5. Power Query Editor - Add Column
  • 6. Work with Power Query Editor - Part 1
  • 7. Work with Power Query Editor - Part 2
  • 8. Work with Power Query Editor - Part 3
  • 9.1 Power Query Formulas - Official Microsoft link.html
  • 9. Work with Power Query Editor - Part 4
  • 10. Work with Power Query Editor - Part 5
  • 11. Work with Power Query Editor - Part 6
  • 12. Connection Properties
  • 13. Pro Tip - Fast Data Load
  • 14. Sort Table by Month

  • 4. Dashboard Tools
  • 1. Final Dashboard preview
  • 2. Pivot Table in general
  • 3. Pivot Table Options
  • 4. Pivot Table 1 and Basics
  • 5. Pivot Chart
  • 6. Slicer and Report Connections
  • 7. TimeLine

  • 5. Creating the Dashboard
  • 1. Pivot Table - Total Income
  • 2. Pivot Table - Total Quantity
  • 3. Pivot Table - On Time percent
  • 4. Pivot Table - Product Amount
  • 5. Pivot Table - Average days to supply
  • 6. Pivot Chart - Money per Category
  • 7. Pivot Chart - Money per Month, change month to number
  • 8. Pivot Chart - Quantity per Category
  • 9. Pivot Chart - Quantity per Location
  • 10. Pivot Chart - Days to Supply per Category
  • 11. Pivot Chart - On Time per Distributor
  • 12. Slicer - Category
  • 13. Slicer - Month
  • 14. Slicer - Distributor
  • 15. Slicer - Location

  • 6. Design
  • 1. Background, Picture, Themes, Gridlines
  • 2. Graph Design
  • 3. Slicer Design
  • 4. Align text and Text size
  • 5. View
  • 6. Save As
  • 45,900 تومان
    بیش از یک محصول به صورت دانلودی میخواهید؟ محصول را به سبد خرید اضافه کنید.
    خرید دانلودی فوری

    در این روش نیاز به افزودن محصول به سبد خرید و تکمیل اطلاعات نیست و شما پس از وارد کردن ایمیل خود و طی کردن مراحل پرداخت لینک های دریافت محصولات را در ایمیل خود دریافت خواهید کرد.

    ایمیل شما:
    تولید کننده:
    مدرس:
    شناسه: 7954
    حجم: 1963 مگابایت
    مدت زمان: 192 دقیقه
    تاریخ انتشار: 20 اسفند 1401
    طراحی سایت و خدمات سئو

    45,900 تومان
    افزودن به سبد خرید