در حال حاضر محصولی در سبد خرید شما وجود ندارد.
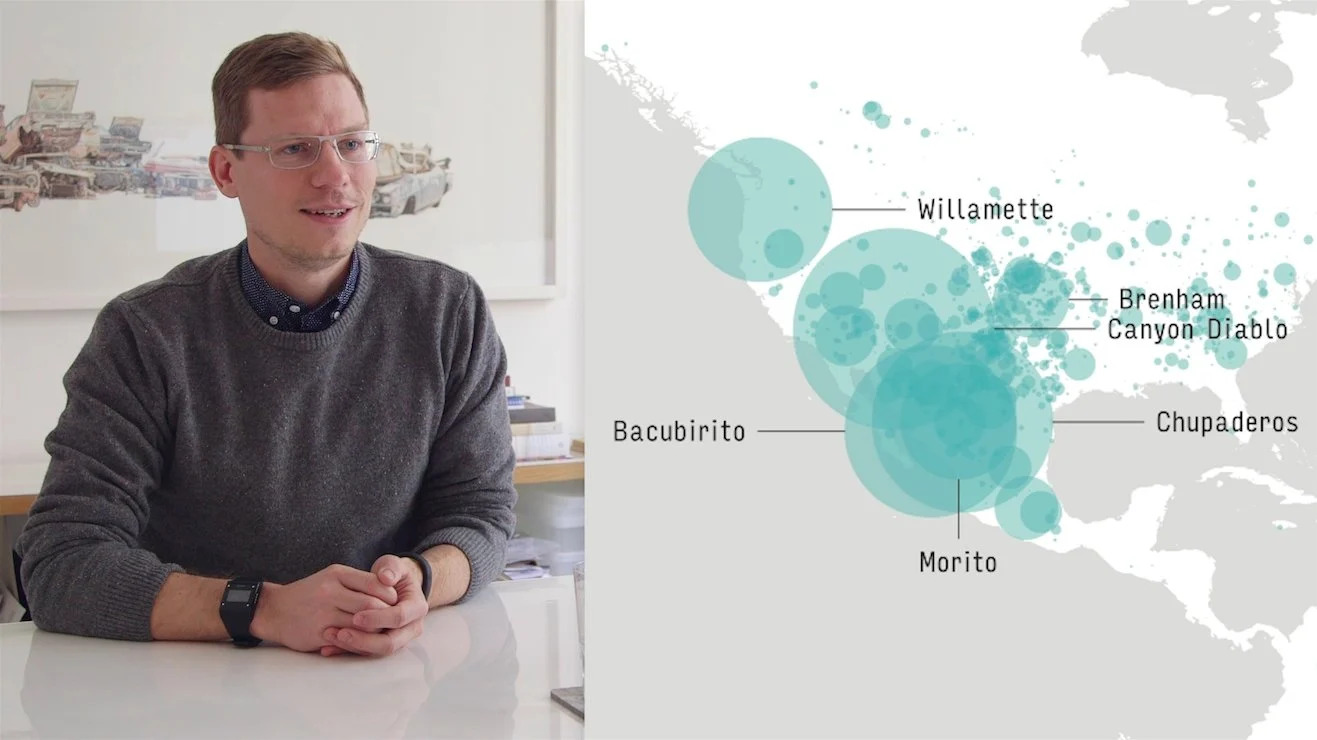
Join Nicholas Felton – author of the Feltron Annual Reports, one of the lead designers of Facebook’s timeline, and co-founder of Daytum – to explore the world with data and design. This 90-minute class walks through the process of investigating a large amount of data, using Processing to project onto a map and polishing the visual appearance in Illustrator. It’s a great introduction to Processing and provides a data set for you to get started with right away, making this class perfect for anyone interested in design, data, geometry, or minimalism. Follow your curiosity and become fluent in presenting the data surrounding us every day.
در این روش نیاز به افزودن محصول به سبد خرید و تکمیل اطلاعات نیست و شما پس از وارد کردن ایمیل خود و طی کردن مراحل پرداخت لینک های دریافت محصولات را در ایمیل خود دریافت خواهید کرد.


فوری … نیمی از محصولات حذف شد! حذف کامل سایت تا اواسط تیر توضیحات