وب سایت تخصصی شرکت فرین
دسته بندی دوره ها

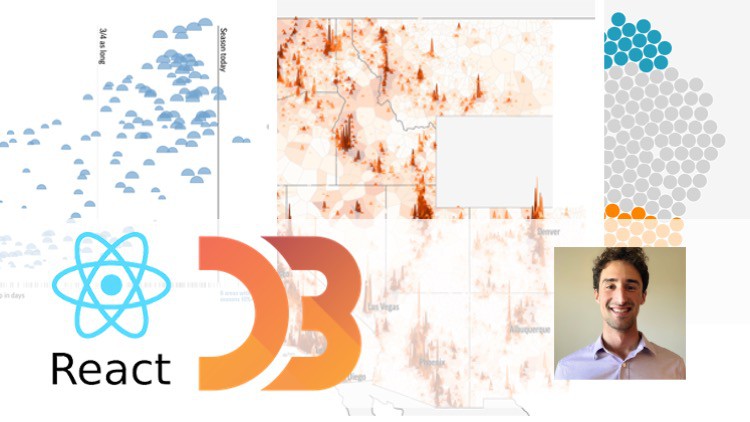
Data Visualization in JavaScript with React and D3.js

سرفصل های دوره

Build beautiful data visualizations and visualization tools with JavaScript


1. Introduction
  • 1. Introduction
  • 2.1 Blog post outlining several approaches to combining React and D3.html
  • 2. Why combine D3 and React
  • 3.1 Course Github Repo (code for all lectures lives here).html
  • 3. How the Course is Structured

  • 2. Review of basic D3 concepts
  • 1.1 Observable notebook to edit.html
  • 1. Introduction to D3 and the Document Object Model (DOM)
  • 2.1 Introduction to D3 from the University of Washingtons Interactive Data Lab.html
  • 2. Data binding with D3
  • 3.1 Completed Observable Notebook.html
  • 3. Scaling and styling data in D3

  • 3. Integrating React and D3 A Declarative Approach
  • 1. Introduction the quickest way to start integrating React and D3
  • 2.1 How to use Create React App.html
  • 2.2 Node.html
  • 2. Setting up our React project environment
  • 3.1 index.zip
  • 3. Functional Components
  • 4.1 Finished code for this lecture.html
  • 4.2 sunshine.zip
  • 4. Loading data from static files
  • 5.1 Finished code for this lecture.html
  • 5. Setting up scales using D3
  • 6.1 Finished code for this lecture.html
  • 6. Mapping over data elements to create JSX
  • 7.1 Finished code for this lecture.html
  • 7. Adding interactivity with useState
  • 8. Pros and Cons of the declarative approach

  • 4. Integrating React and D3 A hybrid approach
  • 1. Introduction the best of both the React and D3 worlds
  • 2.1 index.zip
  • 2.2 utils.zip
  • 2. Project setup and creating the general structure
  • 3.1 Finished code for this lecture.html
  • 3. Adding a useEffect hook with styling
  • 4.1 Finished code for this lecture.html
  • 4. Adding transitions and animation
  • 5. Pros and Cons of this approach

  • 5. Real-world Project Building the Gapminder scatterplot
  • 1.1 gapminder setup instructions.docx
  • 1. Introduction to the Gapminder chart
  • 2.1 app.zip
  • 2.2 Finished code from this lecture.html
  • 2.3 gapminder setup instructions.docx
  • 2.4 index.zip
  • 2.5 legend.zip
  • 2. Loading data and creating the chart components
  • 3.1 Finished code.html
  • 3. Adding scales using D3 and the useEffect hook
  • 4.1 Finished code.html
  • 4. Styling the chart using D3
  • 5.1 Finished code.html
  • 5. Building the chart axes
  • 6.1 Finished code.html
  • 6. Adding a crosshair to display averages
  • 7.1 Finished code.html
  • 7. Adding interactivity building the year slider
  • 8.1 Finished chart code.html
  • 8. Building the interactive Legend

  • 6. Course Wrap-up
  • 1. Publishing your work
  • 2. Final thoughts on React and D3 for data visualization
  • 139,000 تومان
    بیش از یک محصول به صورت دانلودی میخواهید؟ محصول را به سبد خرید اضافه کنید.
    خرید دانلودی فوری

    در این روش نیاز به افزودن محصول به سبد خرید و تکمیل اطلاعات نیست و شما پس از وارد کردن ایمیل خود و طی کردن مراحل پرداخت لینک های دریافت محصولات را در ایمیل خود دریافت خواهید کرد.

    ایمیل شما:
    تولید کننده:
    مدرس:
    شناسه: 13393
    حجم: 1319 مگابایت
    مدت زمان: 183 دقیقه
    تاریخ انتشار: 20 خرداد 1402
    طراحی سایت و خدمات سئو

    139,000 تومان
    افزودن به سبد خرید