در حال حاضر محصولی در سبد خرید شما وجود ندارد.

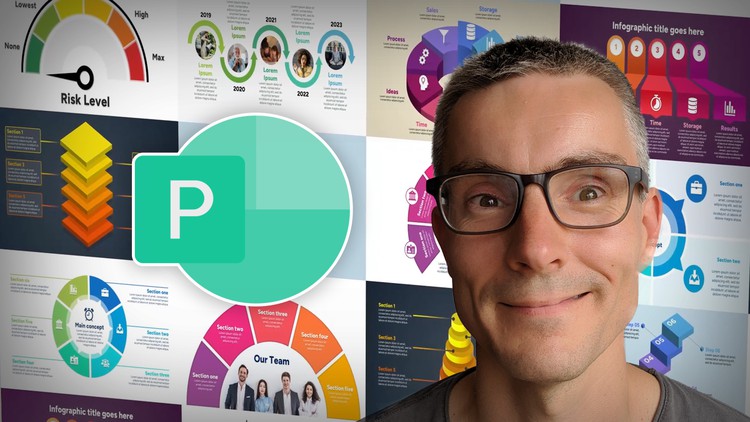
Learn to create 20 effective and successful infographics in PowerPoint from scratch using shapes, text and images.
در این روش نیاز به افزودن محصول به سبد خرید و تکمیل اطلاعات نیست و شما پس از وارد کردن ایمیل خود و طی کردن مراحل پرداخت لینک های دریافت محصولات را در ایمیل خود دریافت خواهید کرد.

✨ تا ۷۰% تخفیف با شارژ کیف پول 🎁
مشاهده پلن ها