در حال حاضر محصولی در سبد خرید شما وجود ندارد.

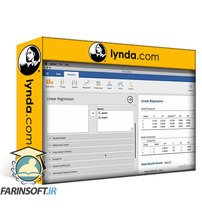
Trying to locate meaning and direction in big data is difficult. R can help you find your way. R is a statistical programming language to analyze and visualize the relationships between large amounts of data. This course with data analytics expert Barton Poulson provides a thorough introduction to R, with detailed instruction for installing and navigating R and RStudio and hands-on examples, from exploratory graphics to neural networks. Barton shows how to get R and popular R packages up and running and start importing, cleaning, and converting data for analysis. He also shows how to create visualizations such as bar charts, histograms, and scatterplots and transform categorical, qualitative, and outlier data to best meet your research questions and the requirements of your algorithms.
در این روش نیاز به افزودن محصول به سبد خرید و تکمیل اطلاعات نیست و شما پس از وارد کردن ایمیل خود و طی کردن مراحل پرداخت لینک های دریافت محصولات را در ایمیل خود دریافت خواهید کرد.


تسلط بر داده ها: کاوش و توصیف داده ها

آموزش مرور و تعریف داده ها
-main-resized.jpg)
پایه های علوم داده ها: اصول
آموزش مدل سازی داده ها در زبان R

آموزش کار با بیگ دیتا در عصر هوش مصنوعی
آموزش فرآیندهای Data Mining در زبان R

Actionable Insights and Business Data in Practice

AI Accountability Essential Training

The Data Science of Healthcare, Medicine, and Public Health

Learning R
