وب سایت تخصصی شرکت فرین
دسته بندی دوره ها
1

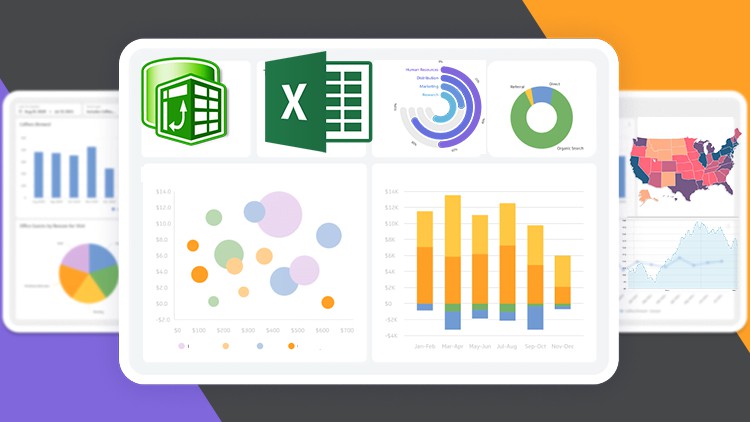
Advanced Microsoft Interactive and Dynamic Excel Dashboard

سرفصل های دوره

2023 (Edition) Start an Advanced Excel Dashboard Today using Power Pivot, DAX, Power Query and Advanced Excel Functions


1 - Getting Started
  • 1 - Why do we need to use Power Query Power Pivot
  • 2 - Advanced Process to a Better Dashboard Creation
  • 3 - All-Resources.zip
  • 3 - Course Materials

  • 2 - Advanced Power Query In Excel for Data Cleaning and Transformation
  • 4 - All-Resources.zip
  • 4 - Complet-Dashboard.zip
  • 4 - Complet-Dataset-for-practice.zip
  • 4 - Customer-Dashboard-and-dataset.zip
  • 4 - Project Overview
  • 5 - How to Activate Microsoft Excel Power Pivot
  • 6 - Importing data into Power Query
  • 7 - Power Query Transform vs Add Columns explained
  • 8 - Importing Multiple tables into Power Query
  • 9 - Updating your current Workbook Settings to get proper Dates and Time
  • 10 - Checking errors and remove columns and rows in Power Query
  • 11 - How to add Index number in Power Query
  • 12 - Merging Queries in Power Query
  • 13 - Basic way to Append Queries
  • 14 - Best way to Append Queries using Folder with Auto Update
  • 15 - Creating a Custom Calendar Table in Power Query
  • 16 - Better way to Create a Date Table in Power Query Auto Update
  • 17 - How to Move data into Power Pivot from Worksheet
  • 18 - Important Data Source Settings in Power Query
  • 19 - Data view vs Diagram view
  • 20 - Understand Database Normalization
  • 21 - Creating Relationships in Power Pivot
  • 22 - How to Edit Relationships in Power Pivot
  • 23 - Power Pivot view vs Normal Excel Pivot Table
  • 24 - Power Query and Data Modelling conclusion
  • 3 - How to Write DAX in Excel Power Pivot to create Advanced Dashboards or Reports
  • 25 - Introduction to DAX in Excel Power Pivot
  • 26 - How to add DAX Calculated Column
  • 27 - Calculated Column with Dax If function
  • 28 - Calculated Column with Dax Switch function
  • 29 - Total Revenue with Calculated Column
  • 30 - Introduction to DAX Measures in Power Pivot
  • 31 - How to write DAX using the Measure BOX
  • 32 - Implicit vs Explicit Measures

  • 4 - DAX Pack common DAX functions
  • 33 - How to create a Separate Measures Table
  • 34 - How to calculate COGS and Gross profit
  • 35 - Calculating returned Rate using DAX
  • 36 - How to use DAX All Function
  • 37 - How to use the DAX Filter Function
  • 38 - Filtering Table with DAX Function
  • 39 - How to mark your Date Table
  • 40 - Time Intelligence YTD MTD and QTD DAX Function
  • 41 - Last month Revenue and MoM percentage Change
  • 42 - How to calculate 10Days Rolling total
  • 43 - How to calculate 10 Days Transactional Average
  • 44 - Better to Count using DAX

  • 5 - Advanced Customer Dashboard in Excel using DAX and Excel Functions
  • 45 - Dashboard overview
  • 46 - Setting Dashboard Canvas
  • 47 - How to add MCode Last Update date code
  • 48 - Adding values to cards
  • 49 - Adding Icons
  • 50 - Adding new cards with Gradient colors
  • 51 - How to create a Dynamic Top N in Excel
  • 52 - Creating a dynamic Title
  • 53 - How to create multiple Doughnut chart
  • 54 - Inserting a Bar charts
  • 55 - How to create a Map chart
  • 56 - 5 Less and Top Profitable Cities
  • 57 - How to connect Slicers to PivotTables

  • 6 - Adidas Sales Dashboard
  • 58 - Adidas-Dataset.zip
  • 58 - Adidas-dashboard.zip
  • 58 - Dashboard Overview
  • 59 - Transforming and Cleaning data with Power Query
  • 60 - Inserting PivotTable and Advanced Number formatting
  • 61 - Adding Month Filter
  • 62 - Dynamic way to show previous Month revenue with Percentage Change
  • 63 - Quantity Ordered and Transaction Cards
  • 64 - Which Product contributed more to Revenue
  • 65 - Which State should we push more Products to
  • 66 - What is the peak month for 2020 and 2021
  • 67 - Whats our top Region Sales Channel
  • 68 - Revenue trend by Weekday
  • 69 - Connecting Slicers to PivotTables
  • 70 - How to create a Single Button that clear all filters
  • 71 - New way to save your work
  • 72 - Formatting Slicers
  • 73 - Cleaning up your dashboard

  • 7 - Full Dynamic HR Human Resources Dashboard
  • 74 - Animated-Images.zip
  • 74 - Complet-HR-Dashboard.zip
  • 74 - Dashboard Overview
  • 74 - HR-Dataset.zip
  • 75 - Importing data into Excel Power Query
  • 76 - Removing unwanted columns in Power Query
  • 77 - Transforming Hr data in Excel Power Query
  • 78 - Cleaning the Dashboard area Canvas
  • 79 - Formatting your DataTable
  • 80 - 06 Employees KPI
  • 81 - Adding shapes to the dashboard environment
  • 82 - How to download Gif animated images to Excel
  • 83 - Creating chart for attrition and current employees
  • 84 - Employees by performance Status
  • 85 - How to create an icon slicer in Excel
  • 86 - Attrition by distance from work with dynamic legend
  • 87 - Attrition by job role visual
  • 88 - Formatting legends
  • 89 - Job role average Attrition
  • 90 - Attrition by Education types
  • 91 - How to create a custom chart in Microsoft Excel
  • 92 - Attrition by age Bucket and Gender
  • 93 - Custom chart for Gender
  • 94 - Average Age for employees
  • 95 - How to format Excel Slicers
  • 96 - Final formatting
  • 139,000 تومان
    بیش از یک محصول به صورت دانلودی میخواهید؟ محصول را به سبد خرید اضافه کنید.
    خرید دانلودی فوری

    در این روش نیاز به افزودن محصول به سبد خرید و تکمیل اطلاعات نیست و شما پس از وارد کردن ایمیل خود و طی کردن مراحل پرداخت لینک های دریافت محصولات را در ایمیل خود دریافت خواهید کرد.

    ایمیل شما:
    تولید کننده:
    شناسه: 10542
    حجم: 7757 مگابایت
    مدت زمان: 815 دقیقه
    تاریخ انتشار: ۸ اردیبهشت ۱۴۰۲
    طراحی سایت و خدمات سئو

    139,000 تومان
    افزودن به سبد خرید