در حال حاضر محصولی در سبد خرید شما وجود ندارد.

Learn and compare the three most used data visualization tools in one course- Tableau, Microsoft Excel & Google's Looker
در این روش نیاز به افزودن محصول به سبد خرید و تکمیل اطلاعات نیست و شما پس از وارد کردن ایمیل خود و طی کردن مراحل پرداخت لینک های دریافت محصولات را در ایمیل خود دریافت خواهید کرد.


Machine Learning with TensorFlow on Google Cloud

Marketing Analytics & Retail Business Management using Excel

Tableau & Tableau Prep for Data Preparation & Visualization
![Power BI and Tableau for Data Visualization [2-in-1 Bundle]](https://farinmedia.ir/farinmedia-img/https://img.farinmedia.ir/images-123/34208.jpgmain-resized.jpg)
Power BI and Tableau for Data Visualization [2-in-1 Bundle]
تجزیه و تحلیل رگرسیون خطی در پایتون
![Become a Data Scientist: SQL, Tableau, ML & DL [4-in-1]](https://farinmedia.ir/farinmedia-img/https://farinmedia.ir/farinmedia-img/images-123/13291.jpgmain-resized.jpg)
Become a Data Scientist: SQL, Tableau, ML & DL [4-in-1]
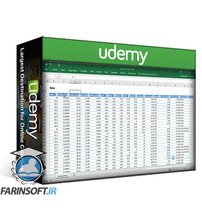
آموزش مصور سازی داده ها در Excel : نمودارها و گراف ها

Tableau for HR: HR Analytics and Visualization with Tableau

Machine Learning with TensorFlow on Google Cloud

Master SPC Control Charts using MS Excel