وب سایت تخصصی شرکت فرین
دسته بندی دوره ها

2023 Python for Machine Learning & Data Science Projects

سرفصل های دوره

1. 1 Python Crash Course
  • 1. Introduction.html
  • 2. Arithmatic Operations in Python
  • 3. Data Types in Python
  • 4. Variable Casting
  • 5. Strings Operation in Python
  • 6. String Slicing in Python
  • 7. String Formatting and Modification
  • 8. Boolean Variables and Evaluation
  • 9. List in Python
  • 10. Tuple in Python
  • 11. 10 Set
  • 12. Dictionary
  • 13. Conditional Statements - If Else
  • 14. While Loops
  • 15. For Loops
  • 16. Functions
  • 17. Working with Date and Time
  • 18. File Handling Read and Write

  • 2. Numpy Crash Course
  • 1. Numpy Introduction - Create Numpy Array
  • 2. Array Indexing and Slicing
  • 3. Numpy Data Types
  • 4. np.nan and np.inf
  • 5. Statistical Operations
  • 6. Shape(), Reshape(), Ravel(), Flatten()
  • 7. arange(), linspace(), range(), random(), zeros(), and ones()
  • 8. Where
  • 9. Numpy Array Read and Write
  • 10. Concatenation and Sorting

  • 3. Pandas for Data Analysis
  • 1. Pandas Series Introduction Part 1
  • 2. Pandas Series Introduction Part 2
  • 3. Pandas Series Read From File
  • 4. Apply Pythons Built in Functions to Series
  • 5. apply() for Pandas Series
  • 6. Pandas DataFrame Creation from Scratch
  • 7. Read Files as DataFrame
  • 8. Columns Manipulation Part 1
  • 9. Columns Manipulation Part 2
  • 10. Arithmetic Operations
  • 11. NULL Values Handling
  • 12. DataFrame Data Filtering Part 1
  • 13. DataFrame Data Filtering Part 2
  • 14. 14 Handling Unique and Duplicated Values
  • 15. Retrive Rows by Index Label
  • 16. Replace Cell Values
  • 17. Rename, Delete Index and Columns
  • 18. Lambda Apply
  • 19. Pandas Groupby
  • 20. Groupby Multiple Columns
  • 21. Merging, Joining, and Concatenation Part 1
  • 22. Concatenation
  • 23. Merge and Join
  • 24. Working with Datetime
  • 25. Read Stock Data from YAHOO Finance
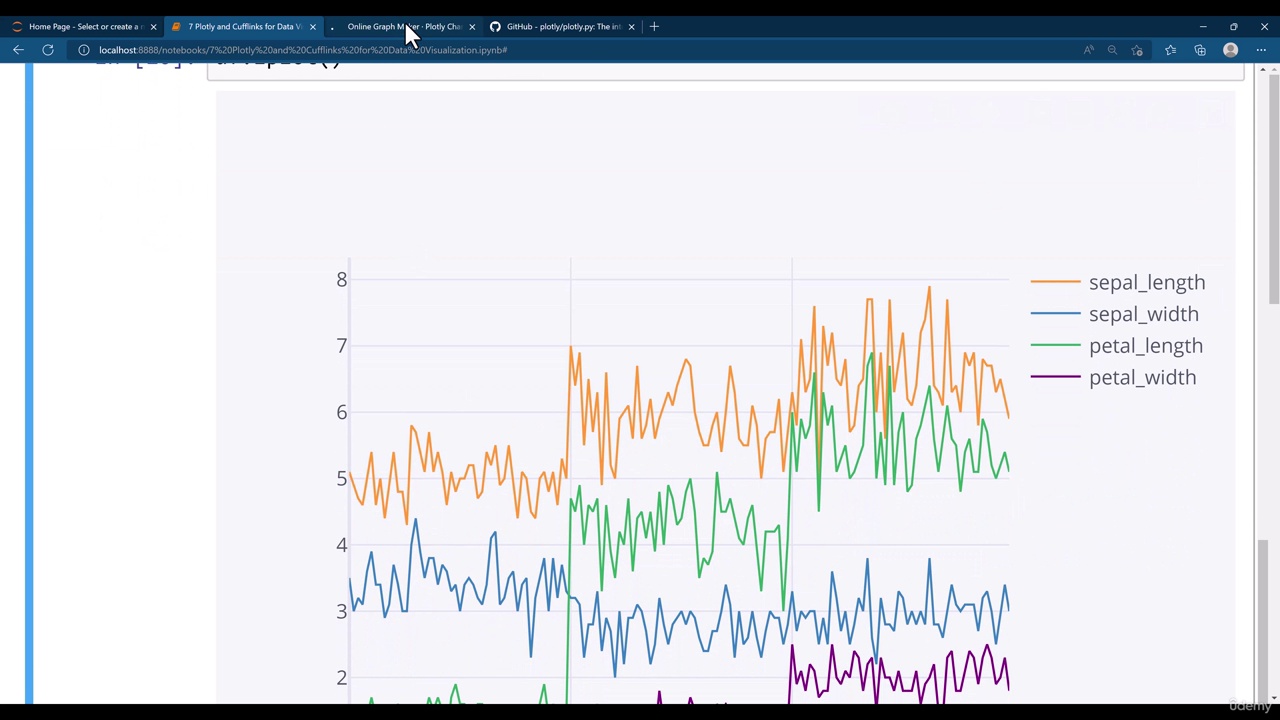
  • 4. Matplotlib for Data Analysis
  • 1. Matplotlib Introduction
  • 2. Matplotlib Line Plot Part 1
  • 3. IMDB Movie Revenue Line Plot Part 1
  • 4. IMDB Movie Revenue Line Plot Part 2
  • 5. Line Plot Rank vs Runtime Votes Metascore
  • 6. Line Styling and Putting Labels
  • 7. Scatter, Bar, and Histogram Plot Part 1
  • 8. Scatter, Bar, and Histogram Plot Part 2
  • 9. Subplot Part 1
  • 10. Subplot Part 2
  • 11. Subplots
  • 12. Creating a Zoomed Sub-Figure of a Figure
  • 13. xlim and ylim, legend, grid, xticks, yticks
  • 14. Pie Chart and Figure Save

  • 5. Seaborn for Data Analysis
  • 1. Introduction
  • 2. Scatter Plot
  • 3. Hue, Style and Size Part1
  • 4. Hue, Style and Size Part2
  • 5. Line Plot Part 1
  • 6. Line Plot Part 2
  • 7. Line Plot Part 3
  • 8. Subplots
  • 9. sns.lineplot() and sns.scatterplot()
  • 10. cat plot
  • 11. Box Plot
  • 12. Boxen Plot
  • 13. Violin Plot
  • 14. Bar Plot
  • 15. Point Plot
  • 16. Joint Plot
  • 17. Pair Plot
  • 18. Regression Plot
  • 19. Controlling Ploted Figure Aesthetics

  • 6. Data Visualization in Pandas
  • 1. IRIS Dataset Introduction
  • 2. Load IRIS Dataset
  • 3. Line Plot
  • 4. Secondary Axis
  • 5. Bar and Barh Plot
  • 6. Stacked Bar Plot
  • 7. Histogram
  • 8. Box Plot
  • 9. Area and Scatter Plot
  • 10. Hexbin Plot
  • 11. Pie Chart
  • 12. Scatter Matrix and Subplots

  • 7. Data Visualization Plotly
  • 1. Introduction to Plotly and Cufflinks
  • 2. Plotly Line Plot
  • 3. Scatter Plot
  • 4. Stacked Bar Plot
  • 5. Box and Area Plot
  • 6. 3D Plot
  • 7. Hist Plot, Bubble Plot and Heatmap

  • 8. Linear Regression
  • 1. Linear Regression Introduction
  • 2. Regression Examples
  • 3. Types of Linear Regression
  • 4. Assessing the performance of the model
  • 5. Bias-Variance tradeoff
  • 6. What is sklearn and train-test-split
  • 7. Python Package Upgrade and Import
  • 8. Load Boston Housing Dataset
  • 9. Dataset Analysis
  • 10. Exploratory Data Analysis- Pair Plot
  • 11. Exploratory Data Analysis- Hist Plot
  • 12. Exploratory Data Analysis- Heatmap
  • 13. Train Test Split and Model Training
  • 14. How to Evaluate the Regression Model Performance
  • 15. Plot True House Price vs Predicted Price
  • 16. Plotting Learning Curves Part 1
  • 17. Plotting Learning Curves Part 2
  • 18. Machine Learning Model Interpretability- Residuals Plot
  • 19. Machine Learning Model Interpretability- Prediction Error Plot
  • 53,700 تومان
    بیش از یک محصول به صورت دانلودی میخواهید؟ محصول را به سبد خرید اضافه کنید.
    خرید دانلودی فوری

    در این روش نیاز به افزودن محصول به سبد خرید و تکمیل اطلاعات نیست و شما پس از وارد کردن ایمیل خود و طی کردن مراحل پرداخت لینک های دریافت محصولات را در ایمیل خود دریافت خواهید کرد.

    ایمیل شما:
    تولید کننده:
    شناسه: 8000
    حجم: 5055 مگابایت
    مدت زمان: 850 دقیقه
    تاریخ انتشار: 20 اسفند 1401
    طراحی سایت و خدمات سئو

    53,700 تومان
    افزودن به سبد خرید